Package gplately
Main objects
GPlately's common objects include:
DataServer
The DataServer object automatically downloads and caches files needed for plate reconstructions to a folder in your system.
These plate reconstruction files include rotation models, topology features and static polygons and geometries such as
coastlines, continents and continent-ocean boundaries. Additional data like rasters, grids and feature data can also be installed.
gdownload = gplately.download.DataServer("Muller2019")

# Download plate reconstruction files and geometries from the Müller et al. 2019 model
rotation_model, topology_features, static_polygons = gdownload.get_plate_reconstruction_files()
coastlines, continents, COBs = gdownload.get_topology_geometries()

# Download the Müller et al. 2019 100 Ma age grid
age_grid = gdownload.get_age_grid(time=100)

# Download the ETOPO1 geotiff raster
etopo = gdownload.get_raster("ETOPO1_tif")
DataServer supports the following plate reconstruction file collections which are bundled with the following data:
| Model name string Identifier | Rot. files | Topology features | Static polygons | Coast-lines | Cont-inents | COB | Age grids | SR grids |
|---|---|---|---|---|---|---|---|---|
| Muller2019 | ✅ | ✅ | ✅ | ✅ | ✅ | ✅ | ✅ | ❌ |
| Muller2016 | ✅ | ✅ | ✅ | ✅ | ❌ | ❌ | ✅ | ❌ |
| Merdith2021 | ✅ | ✅ | ✅ | ✅ | ✅ | ❌ | ❌ | ❌ |
| Cao2020 | ✅ | ✅ | ✅ | ✅ | ✅ | ❌ | ❌ | ❌ |
| Clennett2020 | ✅ | ✅ | ✅ | ✅ | ✅ | ❌ | ✅ | ✅ |
| Seton2012 | ✅ | ✅ | ❌ | ✅ | ❌ | ✅ | ✅ | ❌ |
| Matthews2016 | ✅ | ✅ | ✅ | ✅ | ✅ | ❌ | ❌ | ❌ |
| Merdith2017 | ✅ | ✅ | ❌ | ❌ | ❌ | ❌ | ❌ | ❌ |
| Li2008 | ✅ | ✅ | ❌ | ❌ | ❌ | ❌ | ❌ | ❌ |
| Pehrsson2015 | ✅ | ✅ | ❌ | ❌ | ❌ | ❌ | ❌ | ❌ |
| TorsvikCocks2017 | ✅ | ❌ | ❌ | ✅ | ❌ | ❌ | ❌ | ❌ |
| Young2019 | ✅ | ✅ | ✅ | ✅ | ✅ | ❌ | ❌ | ❌ |
| Scotese2008 | ✅ | ✅ | ❌ | ❌ | ✅ | ❌ | ❌ | ❌ |
| Clennett2020_M19 | ✅ | ✅ | ❌ | ✅ | ✅ | ❌ | ❌ | ❌ |
| Clennett2020_S13 | ✅ | ✅ | ❌ | ✅ | ✅ | ❌ | ❌ | ❌ |
| Muller2008 | ✅ | ❌ | ✅ | ❌ | ❌ | ❌ | ❌ | ❌ |
| Muller2022 | ✅ | ✅ | ✅ | ✅ | ✅ | ✅ | ❌ | ❌ |
| Scotese2016 | ✅ | ❌ | ✅ | ✅ | ❌ | ❌ | ❌ | ❌ |
| Shephard2013 | ✅ | ✅ | ✅ | ✅ | ❌ | ❌ | ❌ | ❌ |
PlateReconstruction
The PlateReconstruction object contains tools to reconstruct geological features like tectonic plates and plate boundaries,
and to interrogate plate kinematic data like plate motion velocities, and rates of subduction and seafloor spreading.
# Build a plate reconstruction model using a rotation model, a set of topology features and static polygons
model = gplately.PlateReconstruction(rotation_model, topology_features, static_polygons)
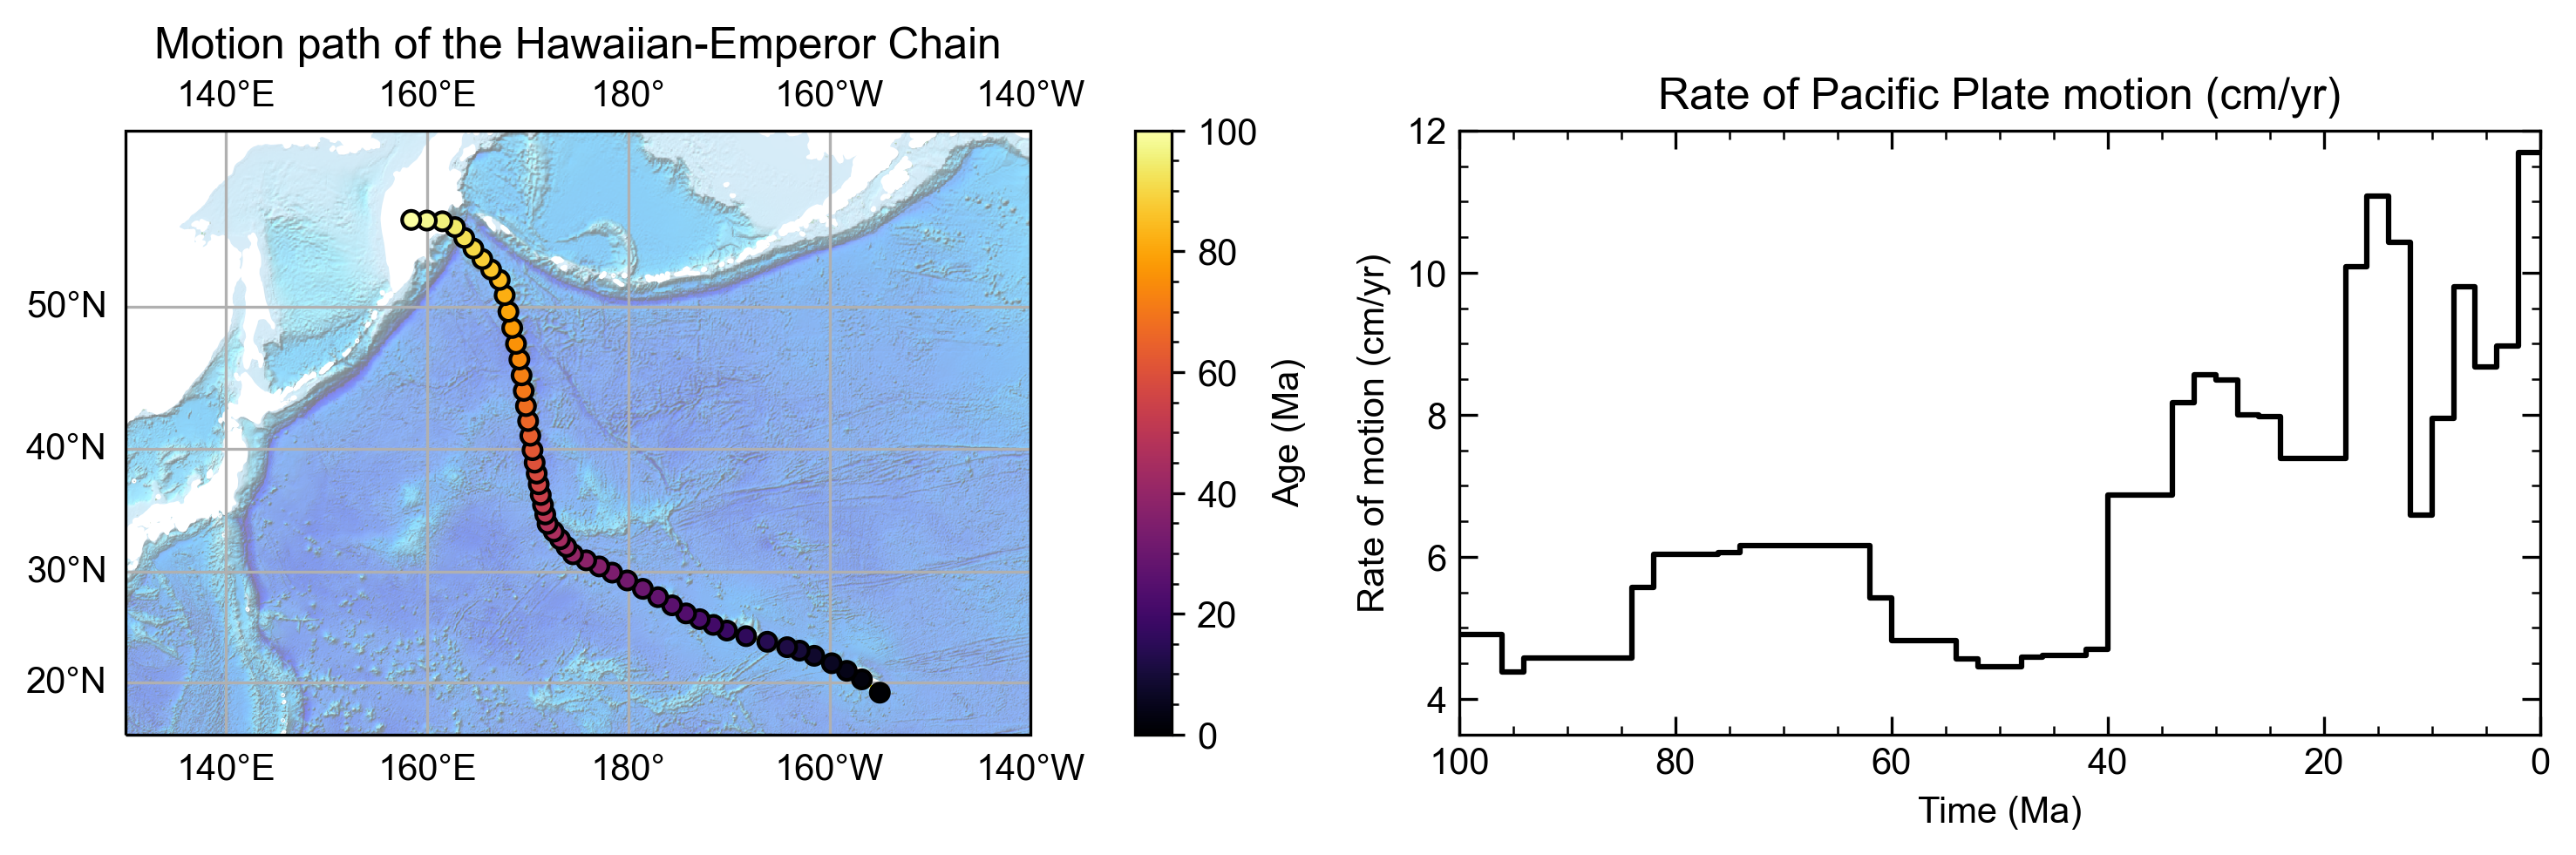
Points
Tools in the Points object track the motion of a point (or group of points) represented by a latitude and longitude
through geologic time. This motion can be visualised using flowlines or motion paths and quantified with point
motion velocities.
# Define some points using their latitude and longitude coordinates so we can track them though time!
pt_lons = np.array([140., 150., 160.])
pt_lats = np.array([-30., -40., -50.])

# Build a Points object from these points
gpts = gplately.Points(model, pt_lons, pt_lats)
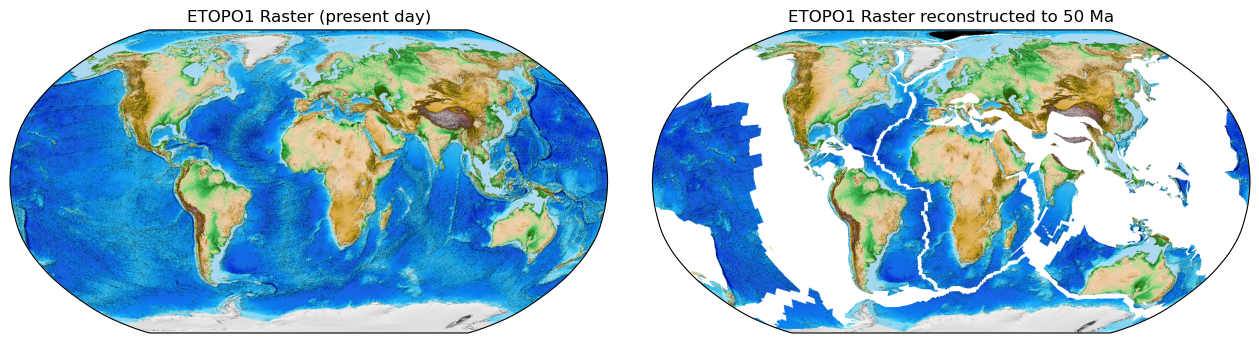
Raster
The Raster object contains tools to work with netCDF4 or MaskedArray gridded data. Grids may be filled,
resized, resampled, and reconstructed back and forwards through geologic time. Other array data can also be
interpolated onto Raster grids.
# Any numpy array can be turned into a Raster object!
raster = gplately.Raster(
    plate_reconstruction=model,
    data=array,
    extent="global",  # equivalent to (-180, 180, -90, 90)
    origin="lower",  # or set extent to (-180, 180, -90, 90)
)

# Reconstruct the raster data to 50 million years ago!
reconstructed_raster = raster.reconstruct(time=50, partitioning_features=continents)
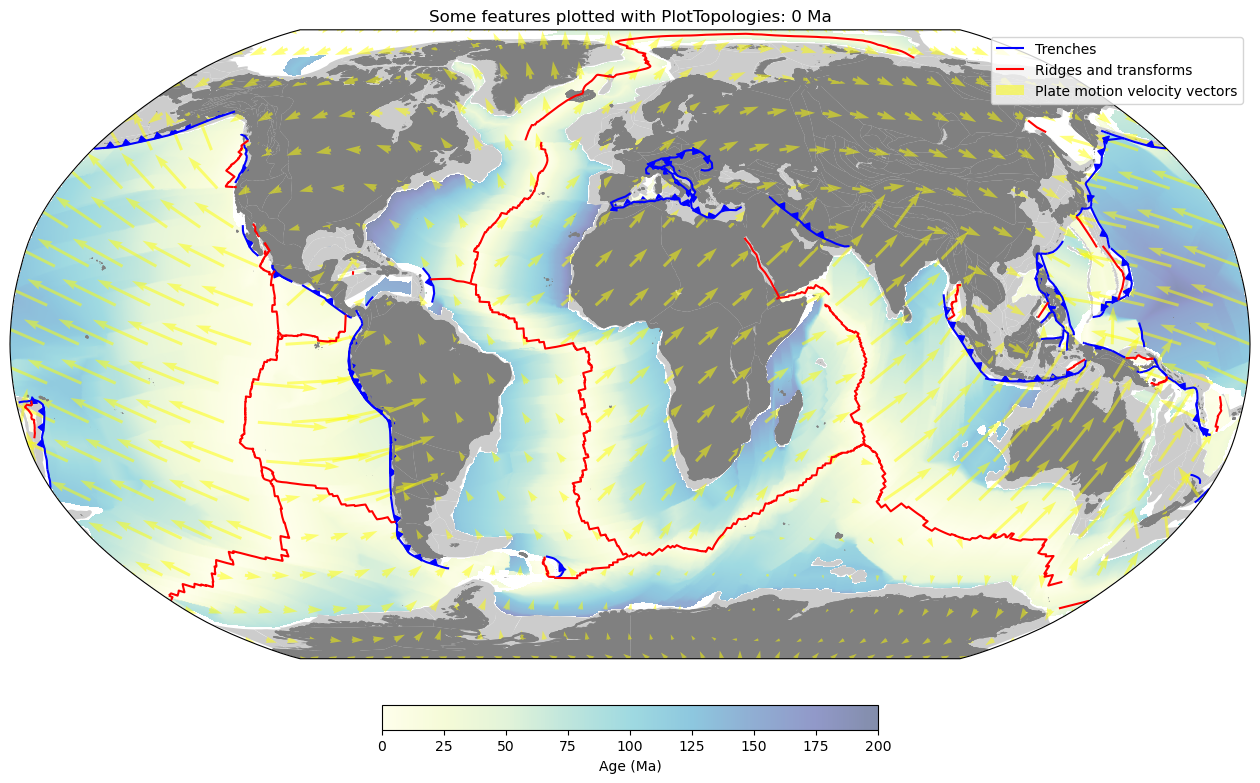
PlotTopologies
PlotTopologies works with the aforementioned PlateReconstruction object to plot
geologic features of different types listed
here, as well as
coastline, continent and continent-ocean boundary geometries reconstructed through time using pyGPlates.
gdownload = gplately.download.DataServer("Muller2019")

# Obtain features for the PlotTopologies object with DataServer
coastlines, continents, COBs = gdownload.get_topology_geometries()

# Call the PlotTopologies object
gplot = gplately.plot.PlotTopologies(
    model, # The PlateReconstruction object - it is an input parameter!
    time,
    coastlines, continents, COBs
)
SeafloorGrid
The SeafloorGrid object wraps an automatic workflow to grid seafloor ages and seafloor spreading rates
as encoded by a plate reconstruction model.
10-SeafloorGrids.ipynb is a tutorial notebook that demonstrates
how to set up and use the SeafloorGrid object, and shows a sample set of output grids.
# Set up automatic gridding from 1000Ma to present day
seafloorgrid = gplately.SeafloorGrid(

    PlateReconstruction_object = model, #The PlateReconstruction object
    PlotTopologies_object = gplot, #The PlotTopologies object

    # Time parameters
    max_time = 1000, #Ma
    min_time = 0, #Ma
)

# Begin automatic gridding!
seafloorgrid.reconstruct_by_topologies()
Notebooks / Examples
- 01 - Getting Started: A brief overview of how to initialise GPlately's main objects
- 02 - Plate Reconstructions: Setting up a
PlateReconstructionobject, reconstructing geological data through time - 03 - Working with Points: Setting up a
Pointsobject, reconstructing seed point locations through time with. This notebook uses point data from the Paleobiology Database (PBDB). - 04 - Velocity Basics: Calculating plate velocities, plotting velocity vector fields
- 05 - Working with Feature Geometries: Processing and plotting assorted polyline, polygon and point data from GPlates 2.3's sample data sets
- 06 - Rasters: Reading, resizing, resampling raster data, and linearly interpolating point data onto raster data
- 07 - Plate Tectonic Stats: Using PlateTectonicTools to calculate and plot subduction zone and ridge data (convergence/spreading velocities, subduction angles, subduction zone and ridge lengths, crustal surface areas produced and subducted etc.)
- 08 - Predicting Slab Flux: Predicting the average slab dip angle of subducting oceanic lithosphere.
- 09 - Motion Paths and Flowlines: Using pyGPlates to create motion paths and flowines of points on a tectonic plate to illustrate the plate's trajectory through geological time.
- 10 - SeafloorGrid: Defines the parameters needed to set up a
SeafloorGridobject, and demonstrates how to produce age and spreading rate grids from a set of plate reconstruction model files.
Expand source code
"""

## Main objects
GPlately's common objects include:
### [DataServer ](https://gplates.github.io/gplately/download.html#gplately.download.DataServer)
The `DataServer` object automatically downloads and caches files needed for plate reconstructions to a folder in your system.
These plate reconstruction files include rotation models, topology features and static polygons and geometries such as
coastlines, continents and continent-ocean boundaries. Additional data like rasters, grids and feature data can also be installed.
```python
gdownload = gplately.download.DataServer("Muller2019")
# Download plate reconstruction files and geometries from the Müller et al. 2019 model
rotation_model, topology_features, static_polygons = gdownload.get_plate_reconstruction_files()
coastlines, continents, COBs = gdownload.get_topology_geometries()
# Download the Müller et al. 2019 100 Ma age grid
age_grid = gdownload.get_age_grid(time=100)
# Download the ETOPO1 geotiff raster
etopo = gdownload.get_raster("ETOPO1_tif")
```
`DataServer` supports the following plate reconstruction file collections which are bundled with the following data:
------------------
| **Model name string Identifier** | **Rot. files** | **Topology features** | **Static polygons** | **Coast-lines** | **Cont-inents** | **COB** | **Age grids** | **SR grids** |
|:--------------------------------:|:--------------:|:---------------------:|:-------------------:|:---------------:|:---------------:|:--------:|:-------------:|:------------:|
| Muller2019 | ✅ | ✅ | ✅ | ✅ | ✅ | ✅ | ✅ | ❌ |
| Muller2016 | ✅ | ✅ | ✅ | ✅ | ❌ | ❌ | ✅ | ❌ |
| Merdith2021 | ✅ | ✅ | ✅ | ✅ | ✅ | ❌ | ❌ | ❌ |
| Cao2020 | ✅ | ✅ | ✅ | ✅ | ✅ | ❌ | ❌ | ❌ |
| Clennett2020 | ✅ | ✅ | ✅ | ✅ | ✅ | ❌ | ✅ | ✅ |
| Seton2012 | ✅ | ✅ | ❌ | ✅ | ❌ | ✅ | ✅ | ❌ |
| Matthews2016 | ✅ | ✅ | ✅ | ✅ | ✅ | ❌ | ❌ | ❌ |
| Merdith2017 | ✅ | ✅ | ❌ | ❌ | ❌ | ❌ | ❌ | ❌ |
| Li2008 | ✅ | ✅ | ❌ | ❌ | ❌ | ❌ | ❌ | ❌ |
| Pehrsson2015 | ✅ | ✅ | ❌ | ❌ | ❌ | ❌ | ❌ | ❌ |
| TorsvikCocks2017 | ✅ | ❌ | ❌ | ✅ | ❌ | ❌ | ❌ | ❌ |
| Young2019 | ✅ | ✅ | ✅ | ✅ | ✅ | ❌ | ❌ | ❌ |
| Scotese2008 | ✅ | ✅ | ❌ | ❌ | ✅ | ❌ | ❌ | ❌ |
| Clennett2020_M19 | ✅ | ✅ | ❌ | ✅ | ✅ | ❌ | ❌ | ❌ |
| Clennett2020_S13 | ✅ | ✅ | ❌ | ✅ | ✅ | ❌ | ❌ | ❌ |
| Muller2008 | ✅ | ❌ | ✅ | ❌ | ❌ | ❌ | ❌ | ❌ |
| Muller2022 | ✅ | ✅ | ✅ | ✅ | ✅ | ✅ | ❌ | ❌ |
| Scotese2016 | ✅ | ❌ | ✅ | ✅ | ❌ | ❌ | ❌ | ❌ |
| Shephard2013 | ✅ | ✅ | ✅ | ✅ | ❌ | ❌ | ❌ | ❌ |
------------------
### [PlateReconstruction](https://gplates.github.io/gplately/reconstruction.html#gplately.reconstruction.PlateReconstruction)
The `PlateReconstruction` object contains tools to reconstruct geological features like tectonic plates and plate boundaries,
and to interrogate plate kinematic data like plate motion velocities, and rates of subduction and seafloor spreading.
```python
# Build a plate reconstruction model using a rotation model, a set of topology features and static polygons
model = gplately.PlateReconstruction(rotation_model, topology_features, static_polygons)
```
### [Points](https://gplates.github.io/gplately/reconstruction.html#gplately.reconstruction.Points)
Tools in the `Points` object track the motion of a point (or group of points) represented by a latitude and longitude
through geologic time. This motion can be visualised using flowlines or motion paths and quantified with point
motion velocities.
```python
# Define some points using their latitude and longitude coordinates so we can track them though time!
pt_lons = np.array([140., 150., 160.])
pt_lats = np.array([-30., -40., -50.])
# Build a Points object from these points
gpts = gplately.Points(model, pt_lons, pt_lats)
```

### [Raster](https://gplates.github.io/gplately/grids.html#gplately.grids.Raster)
The `Raster` object contains tools to work with netCDF4 or MaskedArray gridded data. Grids may be filled,
resized, resampled, and reconstructed back and forwards through geologic time. Other array data can also be
interpolated onto `Raster` grids.
```python
# Any numpy array can be turned into a Raster object!
raster = gplately.Raster(
plate_reconstruction=model,
data=array,
extent="global", # equivalent to (-180, 180, -90, 90)
origin="lower", # or set extent to (-180, 180, -90, 90)
)
# Reconstruct the raster data to 50 million years ago!
reconstructed_raster = raster.reconstruct(time=50, partitioning_features=continents)
```

### [PlotTopologies](https://gplates.github.io/gplately/plot.html#gplately.plot.PlotTopologies)
`PlotTopologies` works with the aforementioned `PlateReconstruction` object to plot
geologic features of different types listed
[here](https://gplates.github.io/gplately/plot.html#gplately.plot.PlotTopologies), as well as
coastline, continent and continent-ocean boundary geometries reconstructed through time using pyGPlates.
```python
gdownload = gplately.download.DataServer("Muller2019")
# Obtain features for the PlotTopologies object with DataServer
coastlines, continents, COBs = gdownload.get_topology_geometries()
# Call the PlotTopologies object
gplot = gplately.plot.PlotTopologies(
model, # The PlateReconstruction object - it is an input parameter!
time,
coastlines, continents, COBs
)
```

### [SeafloorGrid](https://gplates.github.io/gplately/oceans.html#gplately.oceans.SeafloorGrid)
The `SeafloorGrid` object wraps an automatic workflow to grid seafloor ages and seafloor spreading rates
as encoded by a plate reconstruction model.
[10-SeafloorGrids.ipynb](../gplately/Notebooks/10-SeafloorGrids.ipynb) is a tutorial notebook that demonstrates
how to set up and use the `SeafloorGrid` object, and shows a sample set of output grids.
```python
# Set up automatic gridding from 1000Ma to present day
seafloorgrid = gplately.SeafloorGrid(
PlateReconstruction_object = model, #The PlateReconstruction object
PlotTopologies_object = gplot, #The PlotTopologies object
# Time parameters
max_time = 1000, #Ma
min_time = 0, #Ma
)
# Begin automatic gridding!
seafloorgrid.reconstruct_by_topologies()
```

## Notebooks / Examples
- [__01 - Getting Started__](01-GettingStarted.html): A brief overview of how to initialise GPlately's main objects
- [__02 - Plate Reconstructions__](02-PlateReconstructions.html): Setting up a `PlateReconstruction` object, reconstructing geological data through time
- [__03 - Working with Points__](03-WorkingWithPoints.html): Setting up a `Points` object, reconstructing seed point locations through time with. This notebook uses point data from the Paleobiology Database (PBDB).
- [__04 - Velocity Basics__](04-VelocityBasics.html): Calculating plate velocities, plotting velocity vector fields
- [__05 - Working with Feature Geometries__](05-WorkingWithFeatureGeometries.html): Processing and plotting assorted polyline, polygon and point data from [GPlates 2.3's sample data sets](https://www.earthbyte.org/gplates-2-3-software-and-data-sets/)
- [__06 - Rasters__](06-Rasters.html): Reading, resizing, resampling raster data, and linearly interpolating point data onto raster data
- [__07 - Plate Tectonic Stats__](07-WorkingWithPlateTectonicStats.html): Using [PlateTectonicTools](https://github.com/EarthByte/PlateTectonicTools) to calculate and plot subduction zone and ridge data (convergence/spreading velocities, subduction angles, subduction zone and ridge lengths, crustal surface areas produced and subducted etc.)
- [__08 - Predicting Slab Flux__](08-PredictingSlabFlux.html): Predicting the average slab dip angle of subducting oceanic lithosphere.
- [__09 - Motion Paths and Flowlines__](09-CreatingMotionPathsAndFlowlines.html): Using pyGPlates to create motion paths and flowines of points on a tectonic plate to illustrate the plate's trajectory through geological time.
- [__10 - SeafloorGrid__](10-SeafloorGrids.html): Defines the parameters needed to set up a `SeafloorGrid` object, and demonstrates how to produce age and spreading rate grids from a set of plate reconstruction model files.
"""
__version__ = "1.1"
from . import (
data,
download,
geometry,
gpml,
grids,
read_geometries,
reconstruction,
plot,
oceans,
pygplates,
)
from .data import DataCollection
from .download import DataServer
from .grids import (
Raster,
# TimeRaster,
)
from .read_geometries import get_valid_geometries, get_geometries
from .plot import PlotTopologies
from .reconstruction import (
PlateReconstruction,
Points,
_DefaultCollision,
_ContinentCollision,
_ReconstructByTopologies,
)
from .tools import EARTH_RADIUS
from .oceans import SeafloorGrid
__pdoc__ = {
"data": False,
"_DefaultCollision": False,
"_ContinentCollision": False,
"_ReconstructByTopologies": False,
}
try:
import plate_model_manager
except ImportError:
print("The plate_model_manager is not installed, installing it now!")
import subprocess
import sys
subprocess.call([sys.executable, "-m", "pip", "install", "plate-model-manager"])Sub-modules
gplately.download-
Functions for downloading assorted plate reconstruction data to use with GPlately's main objects. Files are stored in the user's cache and can be …
gplately.feature_filtergplately.geometry-
Tools for converting PyGPlates or GPlately geometries to Shapely geometries for mapping (and vice versa) …
gplately.gpml-
Tools for manipulating GPML (
.gplately.gpml,.gpmlz) files andFeatureandFeatureCollectionobjects … gplately.grids-
Tools for working with MaskedArray, ndarray and netCDF4 rasters, as well as gridded-data …
gplately.oceans-
A module to generate grids of seafloor age, seafloor spreading rate and other oceanic data from the
gplately.PlateReconstructionand … gplately.parallel-
Tools to execute routines efficiently by parallelising them over several threads. This uses multiple processing units.
gplately.plot-
Tools for reconstructing and plotting geological features and feature data through time …
gplately.pygplates-
A light wrapping of some
pyGPlatesclasses to keep track of filenames … gplately.read_geometries-
Tools to read geometry data from input files and output them as
Shapelygeometries. These geometries can be plotted directly with GPlately's … gplately.reconstruction-
Tools that wrap up pyGplates and Plate Tectonic Tools functionalities for reconstructing features, working with point data, and calculating plate …
gplately.tools-
A module that offers tools for executing common geological calculations, mathematical conversions and numpy conversions.