Minimal Working Example
Follow the steps below to create your own first paleogeographic map.
Note
You need to know how to use a terminal to follow the instructions below.
Option 1: Python Script
Step 1: use micromamba to create a GPlately environment.
$ micromamba create -n my-gplately-env
$ micromamba activate my-gplately-env
$ micromamba install -c conda-forge gplately
See also
Step 2: create a gplately_hello_world.py file and copy & paste the Python code below.
 1import cartopy.crs as ccrs
 2import matplotlib.pyplot as plt
 3
 4import gplately
 5
 6# create a basemap using Mollweide projection
 7ax = plt.figure(figsize=(8, 4)).add_subplot(111, projection=ccrs.Mollweide(180))
 8
 9# get a PlotTopologies object
10gplot = gplately.auxiliary.get_gplot("Muller2019", time=100)
11
12# use the PlotTopologies object to plot a paleo-coastlines map
13gplot.plot_coastlines(ax, color="lightblue",facecolor="0.8")
14
15# add title for the map
16plt.title(f"{int(gplot.time)} Ma")
17
18# save the map to a .png file
19plt.gcf().savefig("gplately-hello-world.png")
Step 3: run the Python file and check the map.
$ python3 gplately_hello_world.py
Open the file
gplately-hello-world.pngin your current working directory. The paleogeographic map created by the code above shows the coastlines from 100 million years ago.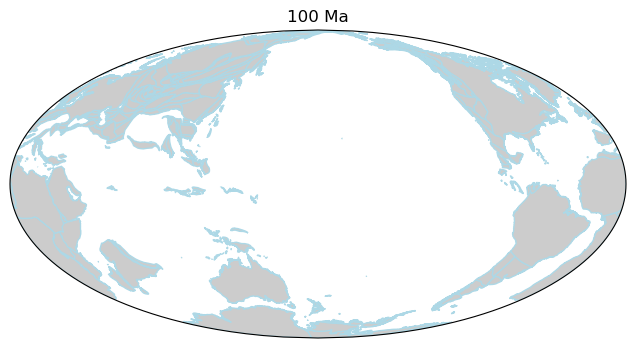
Option 2: Jupyter Notebook
Step 1: use micromamba to create a GPlately environment.
$ micromamba create -n my-gplately-env
$ micromamba activate my-gplately-env
$ micromamba install -c conda-forge gplately jupyter
See also
Step 2: start a Jupyter Notebook server.
$ jupyter notebook
See also
Step 3: create an empty notebook and copy & paste the Python code below.
 1import cartopy.crs as ccrs
 2import matplotlib.pyplot as plt
 3
 4import gplately
 5
 6# create a basemap using Mollweide projection
 7ax = plt.figure(figsize=(8, 4)).add_subplot(111, projection=ccrs.Mollweide(180))
 8
 9# get a PlotTopologies object
10gplot = gplately.auxiliary.get_gplot("Muller2019", time=100)
11
12# use the PlotTopologies object to plot a paleo-coastlines map
13gplot.plot_coastlines(ax, color="lightblue",facecolor="0.8")
14
15# add title for the map
16plt.title(f"{int(gplot.time)} Ma")
17
18# display the map
19plt.show()
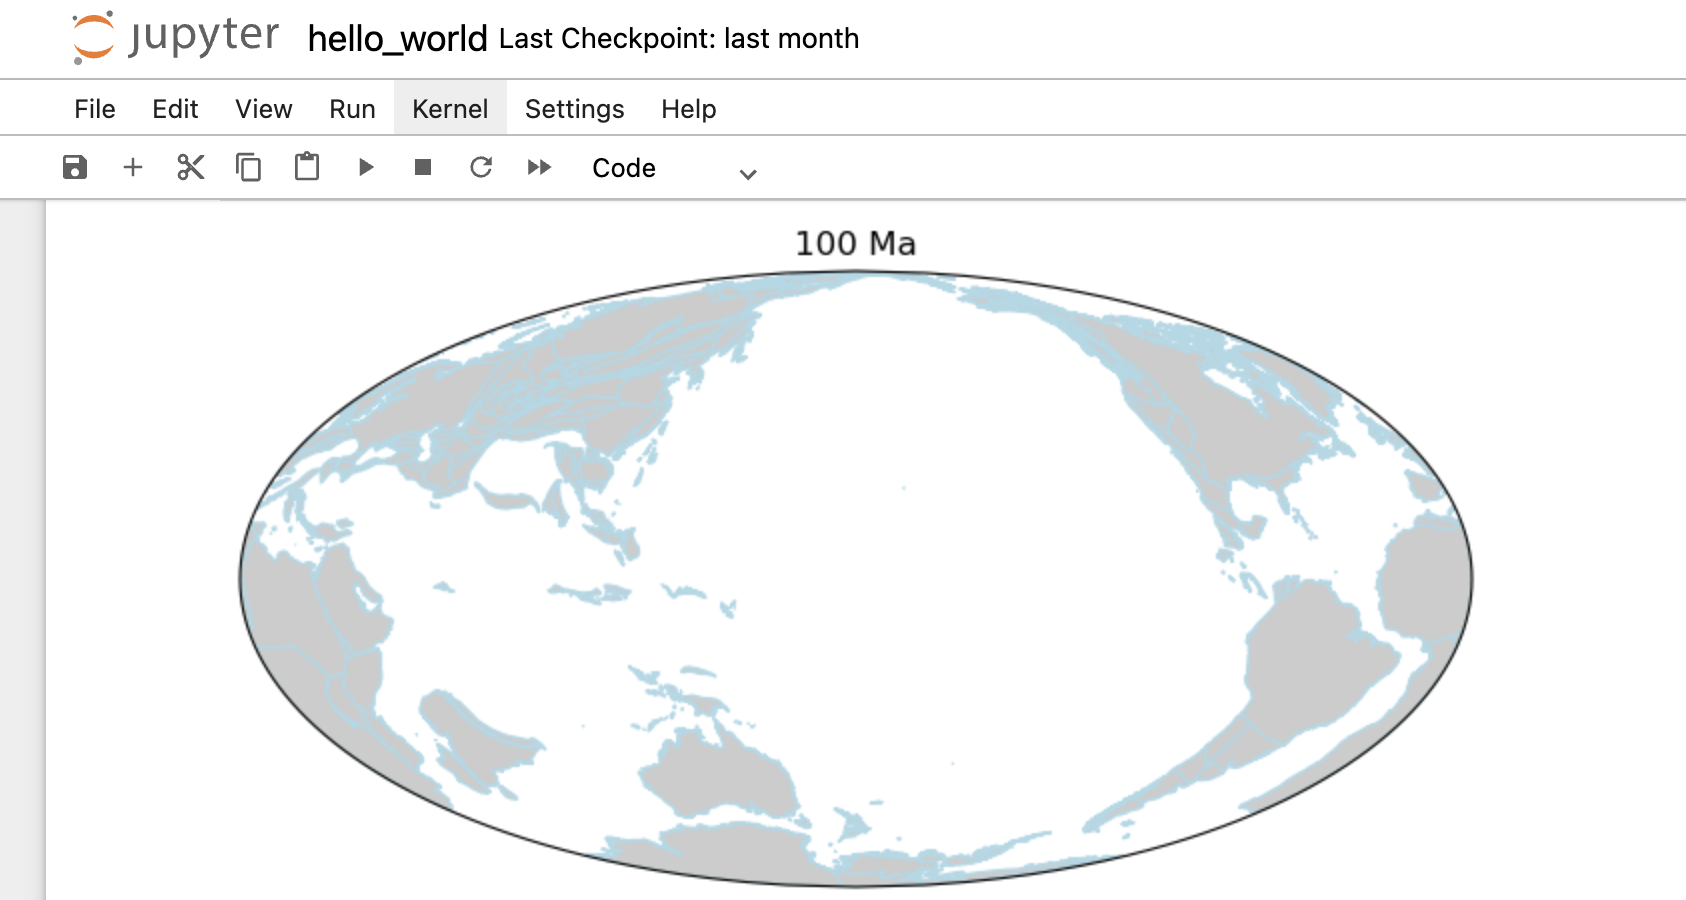
Step 4: run the notebook and check the map.
The map will be displayed inline within the Jupyter Notebook’s web interface. The paleogeographic map created by the code above shows the coastlines from 100 million years ago.