Package gplately
Version - latest indev
Introduction
TODO
Installation
1. Using conda (recommended)
The latest stable public release of GPlately can be installed using conda from the "conda-forge" channel. The following commands will create a new conda environment called "my-gplately-conda-env" and install GPlately within that environment.
conda create -n my-gplately-conda-env
conda activate my-gplately-conda-env
conda install -c conda-forge gplately
✏️ If conda gets stuck while solving the environment during the installation of GPlately, you can try using micromamba instead.
2. Using pip
GPlately can also be installed using pip.
🟢 Install the latest stable public release from PyPI
pip install gplately
🟢 Install from GitHub repository (if you need the latest code changes on GitHub)
pip install git+https://github.com/GPlates/gplately.git
🟢 Install from a local folder (if you need local code changes)
git clone https://github.com/GPlates/gplately.git gplately.git
cd gplately.git # go into the folder created by "git clone" command
git checkout master # check out the "master" branch or the name of branch you want
git pull # fetch all recent code changes from the GitHub remote repository
# make your local code changes
pip install . # alternatively, you can use "pip install -e ." to install gplately in editable mode
3. Using Docker 🐳
👉 Run GPlately notebooks with Docker
docker pull gplates/gplatelydocker run --rm -ti -p 8888:8888 gplates/gplately- http://localhost:8888
👉 Run GPlately command with Docker
docker run gplates/gplately gplately --versiondocker run gplates/gplately gplately --help
👉 Run your Python script with Docker
docker run -it --rm -v THE_FULL_PATH_TO_YOUR_SCRIPT_FOLDER:/ws -w /ws gplates/gplately python my_script_to_run.py
✏️ Replace THE_FULL_PATH_TO_YOUR_SCRIPT_FOLDER with the full path to the folder containing your script file. In PowerShell, you can use "$PWD" if your script is in the current working directory. On Linux or macOS, you can use `pwd` instead.
Visit this page for more details about using Docker with GPlately.
Minimal working example
- TODO
- Show a basic, functional example with minimal dependencies.
- Keep it simple and easy to understand.
- …should satisfy getting a first user up and running quickly. Where the Quick Start in the GitHub Readme links to the 2nd and 3rd chapters (a quick start does not need to link to the Introduction, the first user is already sufficiently motivated by now).
Can then add more chapters from Dietmar's Quick Start:
- If you prefer using Jupyter Notebook, click here.
- If you prefer using Python script, click here.
Common Use Cases
- This can cover what is currently in our Quick Start.
- Ie, a brief description and code example of each of the main classes (5 or so classes).
PlateModelManager
The PlateModelManager module was introduced as a more efficient alternative to the DataServer class, designed specifically for downloading and managing plate reconstruction model files. More information about the PlateModelManager module can be found in its GitHub repository.
from gplately import (
    PlateModelManager,
    PlateReconstruction,
    PlotTopologies,
    PresentDayRasterManager,
    Raster,
)

model = PlateModelManager().get_model(
    "Muller2019",  # model name
    data_dir="plate-model-repo",  # the folder to save the model files
)

recon_model = PlateReconstruction(
    model.get_rotation_model(),
    topology_features=model.get_layer("Topologies"),
    static_polygons=model.get_layer("StaticPolygons"),
)
gplot = PlotTopologies(
    recon_model,
    coastlines=model.get_layer("Coastlines"),
    COBs=model.get_layer("COBs"),
    time=55,
)
# get present-day topography raster
raster = Raster(PresentDayRasterManager().get_raster("topography"))
# get paleo-agegrid raster at 100Ma from Muller2019 model
agegrid = Raster(model.get_raster("AgeGrids", time=100))
For more example code, a comprehensive example on GitHub demonstrates how to use the PlateModelManager module in details. Another example shows how to use the PlateModelManager module with GPlately.
You may use the auxiliary functions to create the PlateReconstruction and PlotTopologies objects.
from gplately.auxiliary import get_gplot, get_plate_reconstruction

# use the auxiliary function to create a PlateReconstruction object
plate_reconstruction_obj = get_plate_reconstruction("Muller2019")

# use the auxiliary function to create a PlotTopologies object
plot_topologies_obj = get_gplot("Muller2019", time=140)

# there is a PlateReconstruction object inside the PlotTopologies object.
# so, in most cases, a single get_gplot() call is enough.
# you can get the PlateReconstruction object from a PlotTopologies object later, for example
another_plate_reconstruction_obj = plot_topologies_instance.plate_reconstruction
DataServer
The DataServer class allows users to automatically download and cache the necessary files for plate reconstructions to a designated folder on your system.
These files include rotation models, topology features, and static geometries such as coastlines, continents, and continent-ocean boundaries.
Additionally, it supports the retrieval of other data types, including rasters, grids, and feature data.
(Use the newer PlateModelManager whenever possible.)
from gplately.download import DataServer

gdownload = DataServer("Muller2019")

# Download plate reconstruction files and geometries from the Müller et al. 2019 model
rotation_model, topology_features, static_polygons = (
    gdownload.get_plate_reconstruction_files()
)
coastlines, continents, COBs = gdownload.get_topology_geometries()

# Download the Müller et al. 2019 100 Ma age grid
age_grid = gdownload.get_age_grid(times=100)

# Download the ETOPO1 geotiff raster
etopo = gdownload.get_raster("ETOPO1_tif")
Both PlateModelManager and DataServer support the following plate reconstruction models:
| Model name string Identifier | Zenodo | Topology features | Static polygons | Coast-lines | Cont-inents | COB | Age grids | SR grids |
|---|---|---|---|---|---|---|---|---|
| Alfonso2024 | ✅ | ✅ | ✅ | ✅ | ❌ | ❌ | ❌ | ❌ |
| Cao2024 | ✅ | ✅ | ✅ | ✅ | ✅ | ✅ | ❌ | ❌ |
| Muller2022 | ✅ | ✅ | ✅ | ✅ | ✅ | ✅ | ❌ | ❌ |
| Zahirovic2022 | ✅ | ✅ | ✅ | ✅ | ✅ | ❌ | ✅ | ✅ |
| Merdith2021 | ✅ | ✅ | ✅ | ✅ | ✅ | ❌ | ❌ | ❌ |
| Clennett2020 | ✅ | ✅ | ✅ | ✅ | ❌ | ❌ | ✅ | ✅ |
| Clennett2020_M2019 | ✅ | ✅ | ✅ | ✅ | ❌ | ❌ | ✅ | ✅ |
| Clennett2020_S2013 | ✅ | ✅ | ✅ | ✅ | ❌ | ❌ | ❌ | ❌ |
| Muller2019 | ✅ | ✅ | ✅ | ✅ | ✅ | ✅ | ✅ | ❌ |
| Young2018 | ✅ | ✅ | ✅ | ✅ | ✅ | ❌ | ❌ | ❌ |
| TorsvikCocks2017 | ❌ | ❌ | ✅ | ✅ | ❌ | ❌ | ❌ | ❌ |
| Matthews2016 | ✅ | ✅ | ✅ | ✅ | ✅ | ❌ | ❌ | ❌ |
| Matthews2016_pmag_ref | ❌ | ❌ | ✅ | ✅ | ✅ | ❌ | ❌ | ❌ |
| Muller2016 | ✅ | ✅ | ✅ | ✅ | ❌ | ✅ | ✅ | ❌ |
| Scotese2016 | ✅ | ❌ | ✅ | ✅ | ❌ | ❌ | ❌ | ❌ |
| Zahirovic2016 | ✅ | ✅ | ✅ | ✅ | ✅ | ❌ | ❌ | ❌ |
| Gibbons2015 | ✅ | ✅ | ✅ | ✅ | ❌ | ❌ | ❌ | ❌ |
| Zahirovic2014 | ✅ | ❌ | ✅ | ✅ | ❌ | ❌ | ❌ | ❌ |
| Shephard2013 | ✅ | ✅ | ✅ | ✅ | ❌ | ❌ | ❌ | ❌ |
| Gurnis2012 | ✅ | ✅ | ✅ | ✅ | ❌ | ❌ | ❌ | ❌ |
| Seton2012 | ✅ | ✅ | ✅ | ✅ | ✅ | ✅ | ✅ | ❌ |
| Muller2008 | ❌ | ❌ | ✅ | ❌ | ❌ | ❌ | ❌ | ❌ |
Please note that all models have rotation files. The "Zenodo" column indicates whether the model files are available on Zenodo.
PlateReconstruction
The PlateReconstruction class contains tools to reconstruct geological features like tectonic plates and plate boundaries,
and to interrogate plate kinematic data like plate motion velocities, and rates of subduction and seafloor spreading.
from gplately import PlateReconstruction, PlateModelManager

model = PlateModelManager().get_model("Muller2019")

# Build a plate reconstruction model using a rotation model, a set of topology features and static polygons
recon_model = PlateReconstruction(
    model.get_rotation_model(),
    topology_features=model.get_layer("Topologies"),
    static_polygons=model.get_layer("StaticPolygons"),
)
Alternatively, you may use the auxiliary functions to create a PlateReconstruction instance.
from gplately.auxiliary import get_plate_reconstruction

# use the auxiliary function to create a PlateReconstruction instance
plate_reconstruction_instance = get_plate_reconstruction("Muller2019")
This 02-PlateReconstructions.ipynb demonstrates in details
how to use the PlateReconstruction class.
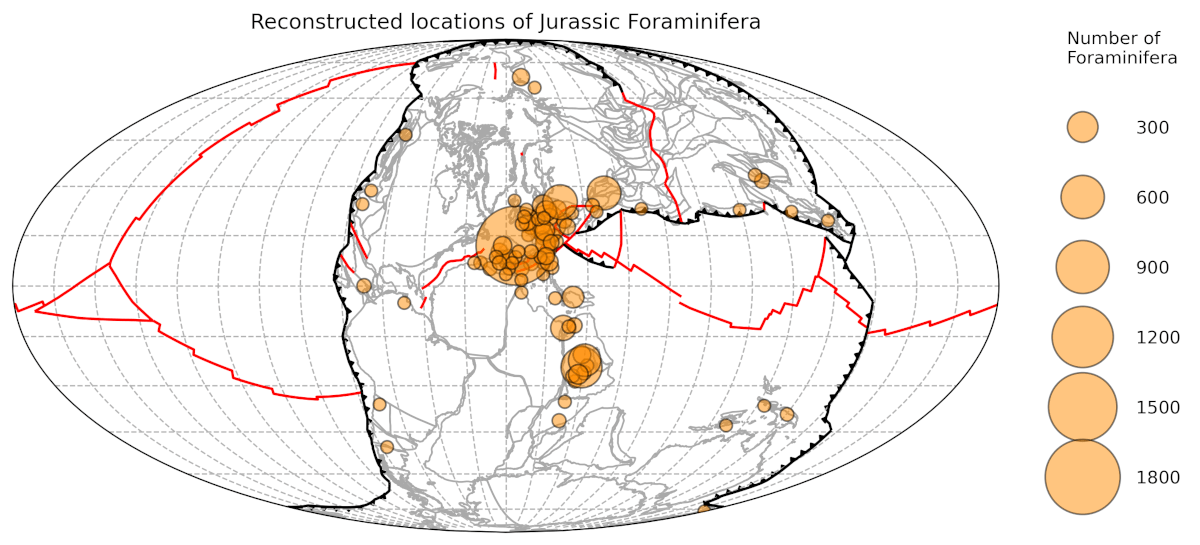
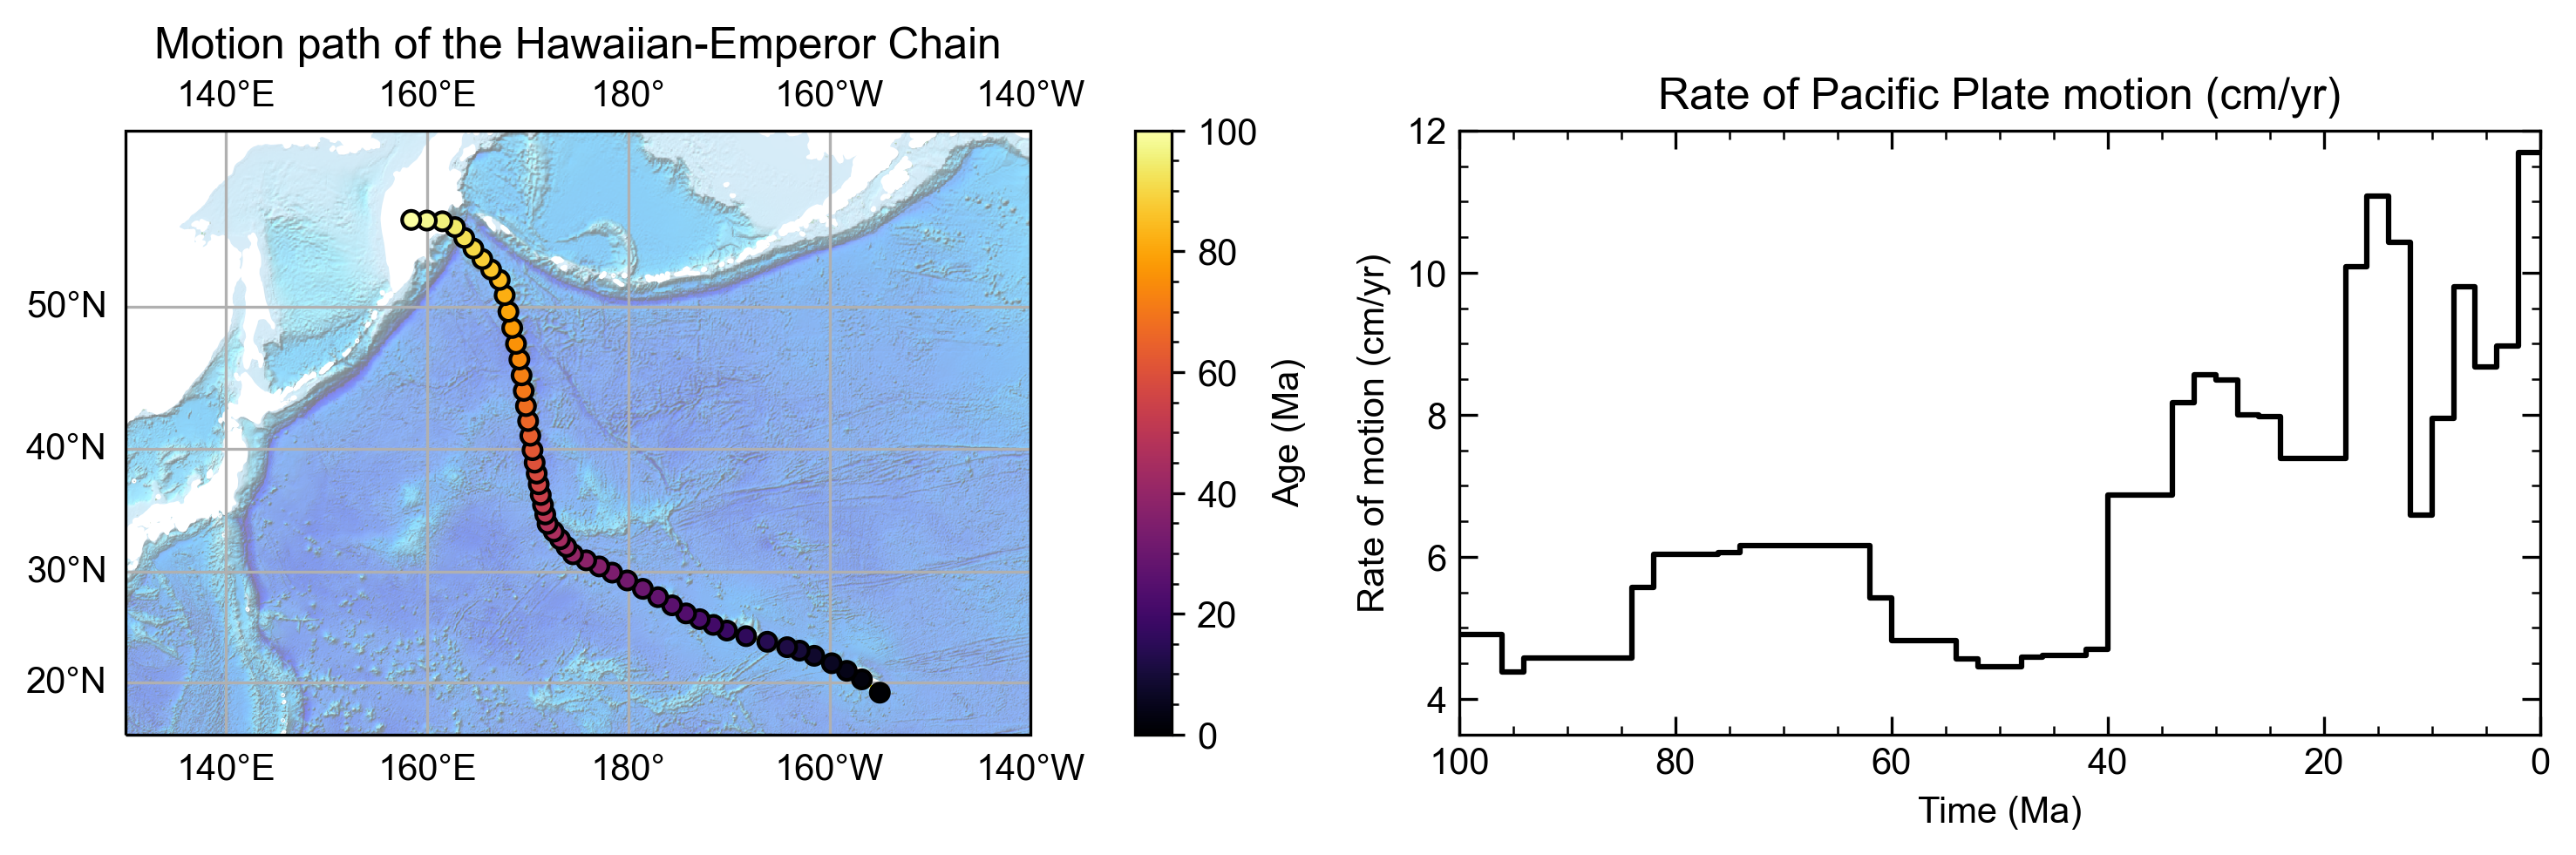
Points
The methods in the Points class track the motion of a point (or group of points) represented by a latitude and longitude
through geologic time. This motion can be visualised using flowlines or motion paths and quantified with point
motion velocities.
import numpy as np

from gplately import PlateModelManager, Points, auxiliary

model = PlateModelManager().get_model("Muller2019")

# Create a plate reconstruction model using a rotation model, a set of topology features and static polygons
recon_model = auxiliary.get_plate_reconstruction(model)

# Define some points using their latitude and longitude coordinates so we can track them though time!
pt_lons = np.array([140.0, 150.0, 160.0])
pt_lats = np.array([-30.0, -40.0, -50.0])

# Create a Points instance from these points
gpts = Points(recon_model, pt_lons, pt_lats)
The 03-WorkingWithPoints.ipynb demonstrates in details
how to use the Points class.
The 09-CreatingMotionPathsAndFlowlines.ipynb demonstrates how to create motion paths and flowlines.
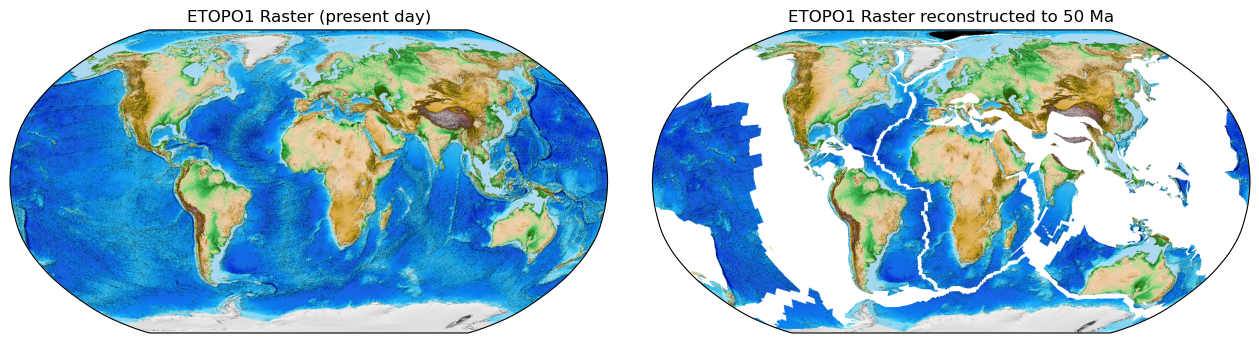
Raster
The Raster class contains methods to work with netCDF4 or MaskedArray gridded data. Grids may be filled,
resized, resampled, and reconstructed back and forwards through geologic time. Other array data can also be
interpolated onto Raster grids.
from gplately import PlateModelManager, PresentDayRasterManager, Raster, auxiliary

model_name = "Muller2019"
# Create a plate reconstruction model using a rotation model, a set of topology features and static polygons
recon_model = auxiliary.get_plate_reconstruction(model_name)

# Any numpy array can be turned into a Raster object!
raster = Raster(
    plate_reconstruction=recon_model,
    data=PresentDayRasterManager().get_raster("topography"),
    extent="global",  # equivalent to (-180, 180, -90, 90)
    origin="lower",  # or set extent to (-180, 180, -90, 90)
)

# Reconstruct the raster data to 50 million years ago!
reconstructed_raster = raster.reconstruct(
    time=50,
    partitioning_features=PlateModelManager()
    .get_model(model_name)
    .get_layer("ContinentalPolygons"),
)
The 06-Rasters.ipynb demonstrates in details
how to use the Raster class.
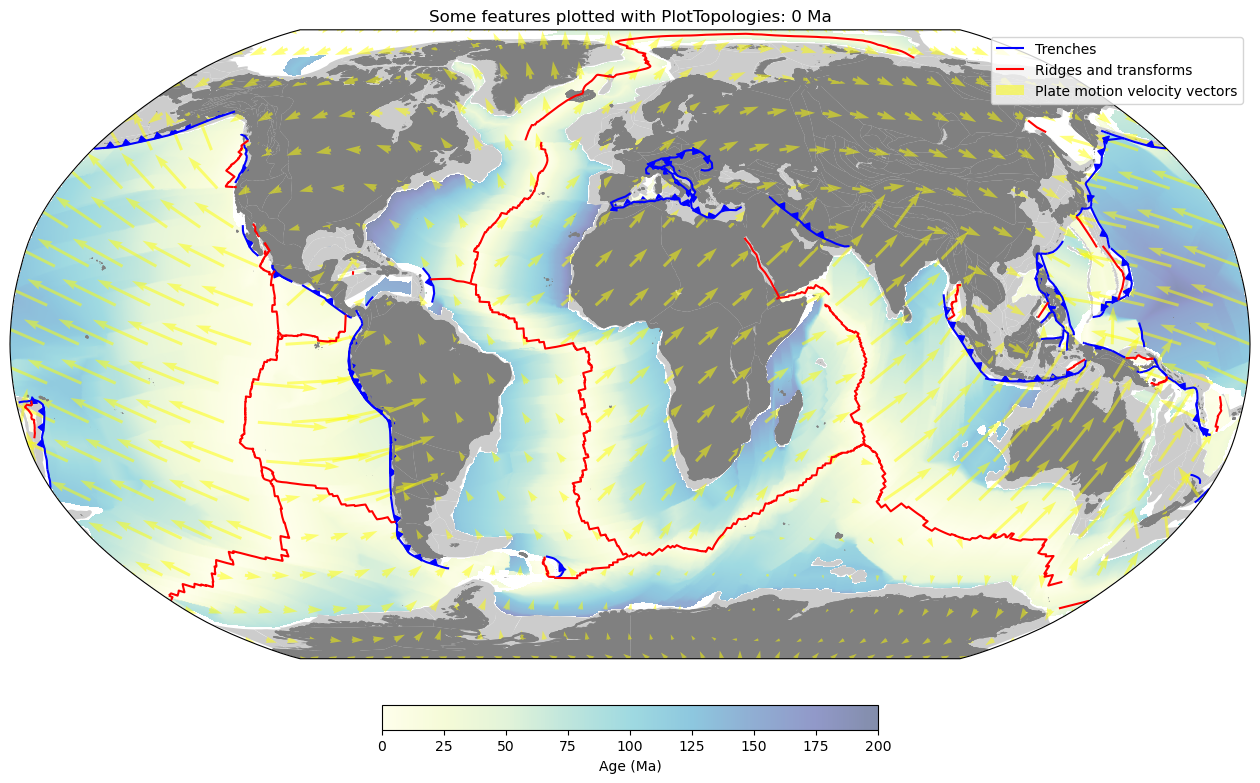
PlotTopologies
The PlotTopologies class works with the aforementioned PlateReconstruction class to plot
geologic features of different types listed
here, as well as
coastline, continent and continent-ocean boundary geometries reconstructed through time using pyGPlates.
from gplately import PlateModelManager, PlotTopologies, auxiliary

model = PlateModelManager().get_model("Muller2019")
recon_model = auxiliary.get_plate_reconstruction(model)

gplot = PlotTopologies(
    recon_model,
    coastlines=model.get_layer("Coastlines"),
    COBs=model.get_layer("COBs"),
    continents=model.get_layer("ContinentalPolygons"),
    time=55,
)
You may use the auxiliary functions to create a PlotTopologies object.
from gplately.auxiliary import get_gplot

# use the auxiliary function to create a PlotTopologies object
plot_topologies_obj = get_gplot("Muller2019", time=55)
The 02-PlateReconstructions.ipynb demonstrates in details
how to use the PlotTopologies class.
SeafloorGrid
The SeafloorGrid class wraps an automatic workflow to grid seafloor ages and seafloor spreading rates
as encoded by a plate reconstruction model.
import os

os.environ["DISABLE_GPLATELY_DEV_WARNING"] = "true"

from gplately import SeafloorGrid, auxiliary

if __name__ == "__main__":
    gplot = auxiliary.get_gplot("Muller2019")

    # Set up automatic gridding from 5Ma to present day
    seafloorgrid = SeafloorGrid(
        PlateReconstruction_object=gplot.plate_reconstruction,  # The PlateReconstruction object
        PlotTopologies_object=gplot,  # The PlotTopologies object
        max_time=5,  # start time (Ma)
        min_time=0,  # end time (Ma)
        ridge_time_step=1,  # time increment (Myr)
    )

    # Begin automatic gridding!
    seafloorgrid.reconstruct_by_topologies()
The 10-SeafloorGrids.ipynb is a tutorial notebook that demonstrates
how to set up and use the SeafloorGrid object, and shows a sample set of output grids.
Trouble-shooting and FAQ
And then instead of Next Steps & Links we just continue with regular detailed documentation chapters:
Examples
- TODO
- Notebooks
-
Other examples (not notebooks).
-
01 - Getting Started: A brief overview of how to initialise GPlately's main objects
- 02 - Plate Reconstructions: Setting up a
PlateReconstructionobject, reconstructing geological data through time - 03 - Working with Points: Setting up a
Pointsobject, reconstructing seed point locations through time with. This notebook uses point data from the Paleobiology Database (PBDB). - 04 - Velocity Basics: Calculating plate velocities, plotting velocity vector fields
- 05 - Working with Feature Geometries: Processing and plotting assorted polyline, polygon and point data from GPlates 2.3's sample data sets
- 06 - Rasters: Reading, resizing, resampling raster data, and linearly interpolating point data onto raster data
- 07 - Plate Tectonic Stats: Calculating and plotting subduction zone and ridge data (convergence/spreading velocities, subduction angles, subduction zone and ridge lengths, crustal surface areas produced and subducted etc.)
- 08 - Predicting Slab Flux: Predicting the average slab dip angle of subducting oceanic lithosphere.
- 09 - Motion Paths and Flowlines: Using pyGPlates to create motion paths and flowines of points on a tectonic plate to illustrate the plate's trajectory through geological time.
- 10 - SeafloorGrid: Defines the parameters needed to set up a
SeafloorGridobject, and demonstrates how to produce age and spreading rate grids from a set of plate reconstruction model files. - 11 - AndesFluxes: Demonstrates how the reconstructed subduction history along the Andean margin can be potentially used in the plate kinematics analysis and data mining.
In addition to the notebooks above, a variety of examples are available to help you get started with GPlately. Visit this page for more details.
Command-line interface
- TODO
- Maybe goes through each command with an example.
- Could possibly be merged into another chapter.
GPlately comes with a collection of useful command-line tools, each designed as a subcommand of GPlately.
For example, the command gplately list shows a list of available reconstruction models.
To view all the available tools, simply run gplately -h. For a detailed list of the tools along with usage examples,
visit this page.
Primer
- TODO
- This is like the Reference Manual mentioned below.
API Reference
- TODO
- This is the main part of GPlately.
- It's covered very well.
Sub-modules
gplately.auxiliarygplately.geometry-
This sub-module contains tools for converting PyGPlates or GPlately geometries to Shapely geometries for mapping (and vice versa) …
gplately.gpml-
This sub-module contains functions for manipulating GPML (
.gplately.gpml,.gpmlz) files, as well aspygplates.Featureandpygplates.FeatureCollection… gplately.grids-
This sub-module contains tools for working with MaskedArray, ndarray and netCDF4 rasters, as well as gridded-data …
gplately.oceans-
A module to generate grids of seafloor age, seafloor spreading rate and other oceanic data from the
PlateReconstructionand … gplately.parallel-
This sub-module contains tools for efficiently executing routines by parallelizing them across multiple threads, utilizing multiple processing units."
gplately.plot-
This sub-module contains tools for reconstructing and plotting geological features and feature data through time …
gplately.ptt-
"ptt" stands for Plate Tectonics Tools …
gplately.reconstruction-
This sub-module contains tools that wrap up pyGPlates and Plate Tectonic Tools functionalities for reconstructing features, working with point data, …
gplately.spatial-
This sub-module contains spatial tools for calculating distances on the Earth.
gplately.tools-
A module that offers tools for executing common geological calculations, mathematical conversions and numpy conversions.
gplately.utils
Classes
class DataServer (file_collection, data_dir=None, verbose=True)-
The DataServer class may be deprecated in the future. We recommend using the newer plate-model-manager module whenever possible.
The methods in this DataServer class download plate reconstruction models to the cache folder on your computer from EarthByte's WebDAV server.
If the
DataServerobject and its methods are called for the first time, i.e. by:# string identifier to access the Muller et al. 2019 model gDownload = gplately.download.DataServer("Muller2019")all requested files are downloaded into the user's 'gplately' cache folder only once. If the same object and method(s) are re-run, the files will be re-accessed from the cache provided they have not been moved or deleted.
This page contains a list of available plate reconstruction models. For more information about these plate models, visit this EarthByte web page.
You can also use the
pmm lscommand to retrieve more information about a model. For instance, runningpmm ls cao2024will display details about the "Cao2024" model. Make sure to install theplate-model-managermodule first by runningpip install plate-model-managerbefore executing this command.Parameters
file_collection:str- model name
verbose:bool, default=True- Toggle print messages regarding server/internet connection status, file availability etc.
Expand source code
class DataServer(object): """The DataServer class may be deprecated in the future. We recommend using the newer [plate-model-manager](https://pypi.org/project/plate-model-manager/) module whenever possible. The methods in this DataServer class download plate reconstruction models to the cache folder on your computer from EarthByte's [WebDAV server](https://repo.gplates.org/webdav/pmm/). If the `DataServer` object and its methods are called for the first time, i.e. by: # string identifier to access the Muller et al. 2019 model gDownload = gplately.download.DataServer("Muller2019") all requested files are downloaded into the user's 'gplately' cache folder only _once_. If the same object and method(s) are re-run, the files will be re-accessed from the cache provided they have not been moved or deleted. [This page](https://gplates.github.io/gplately/dev-doc/#dataserver) contains a list of available plate reconstruction models. For more information about these plate models, visit this [EarthByte web page](https://www.earthbyte.org/category/resources/data-models/global-regional-plate-motion-models/). You can also use the `pmm ls` command to retrieve more information about a model. For instance, running `pmm ls cao2024` will display details about the "Cao2024" model. Make sure to install the `plate-model-manager` module first by running `pip install plate-model-manager` before executing this command. """ def __init__(self, file_collection, data_dir=None, verbose=True): """ Parameters ---------- file_collection: str model name verbose: bool, default=True Toggle print messages regarding server/internet connection status, file availability etc. """ if not data_dir: _data_dir = path_to_cache() else: _data_dir = data_dir self.file_collection = file_collection.capitalize() self.pmm = PlateModelManager().get_model( self.file_collection, data_dir=str(_data_dir) ) if not self.pmm: raise Exception( f"Unable to get plate model {self.file_collection}. Check if the model name is correct." ) self._available_layers = self.pmm.get_avail_layers() self.verbose = verbose # initialise empty attributes self._rotation_model = None self._topology_features = None self._static_polygons = None self._coastlines = None self._continents = None self._COBs = None def _create_feature_collection(self, file_list): feature_collection = _pygplates.FeatureCollection() for feature in file_list: feature_collection.add(_pygplates.FeatureCollection(feature)) return feature_collection @property def rotation_model(self): if self._rotation_model is None and self.pmm: self._rotation_model = _pygplates.RotationModel( self.pmm.get_rotation_model() ) self._rotation_model.reconstruction_identifier = self.file_collection return self._rotation_model @property def topology_features(self): if self._topology_features is None and self.pmm: if "Topologies" in self._available_layers: self._topology_features = self._create_feature_collection( self.pmm.get_topologies() ) else: self._topology_features = [] return self._topology_features @property def static_polygons(self): if self._static_polygons is None and self.pmm: if "StaticPolygons" in self._available_layers: self._static_polygons = self._create_feature_collection( self.pmm.get_static_polygons() ) else: self._static_polygons = [] return self._static_polygons @property def coastlines(self): if self._coastlines is None and self.pmm: if "Coastlines" in self._available_layers: self._coastlines = self._create_feature_collection( self.pmm.get_coastlines() ) else: self._coastlines = [] return self._coastlines @property def continents(self): if self._continents is None and self.pmm: if "ContinentalPolygons" in self._available_layers: self._continents = self._create_feature_collection( self.pmm.get_continental_polygons() ) else: self._continents = [] return self._continents @property def COBs(self): if self._COBs is None and self.pmm: if "COBs" in self._available_layers: self._COBs = self._create_feature_collection(self.pmm.get_COBs()) else: self._COBs = [] return self._COBs @property def from_age(self): if self.pmm: return self.pmm.get_big_time() @property def to_age(self): if self.pmm: return self.pmm.get_small_time() @property def time_range(self): return self.from_age, self.to_age @property def valid_times(self): return self.from_age, self.to_age def get_plate_reconstruction_files(self): """Downloads and constructs a `rotation model`, a set of `topology features` and and a set of `static polygons`. These objects can then be used to create `PlateReconstruction` object. Returns ------- rotation_model : instance of <pygplates.RotationModel> A rotation model to query equivalent and/or relative topological plate rotations from a time in the past relative to another time in the past or to present day. topology_features : instance of <pygplates.FeatureCollection> Point, polyline and/or polygon feature data that are reconstructable through geological time. static_polygons : instance of <pygplates.FeatureCollection> Present-day polygons whose shapes do not change through geological time. They are used to cookie-cut dynamic polygons into identifiable topological plates (assigned an ID) according to their present-day locations. Notes ----- The get_plate_reconstruction_files() method downloads reconstruction files from a given plate model. For example, gDownload = gplately.download.DataServer("Muller2019") rotation_model, topology_features, static_polygons = gDownload.get_plate_reconstruction_files() The code above downloads `rotation model`, `topology features` and `static polygons` files from the Müller et al. (2019) plate reconstruction model. These files can then be used to create `PlateReconstruction` object. model = gplately.reconstruction.PlateReconstruction(rotation_model, topology_features, static_polygons) If the requested plate model does not have certain file(s), a warning message will alert user of the missing file(s). """ return self.rotation_model, self.topology_features, self.static_polygons def get_topology_geometries(self): """Uses the [plate-model-manager](https://pypi.org/project/plate-model-manager/) to download coastline, continent and COB (continent-ocean boundary) Shapely geometries from the requested plate model. These are needed to call the `PlotTopologies` object and visualise topological plates through time. Parameters ---------- verbose : bool, default True Toggle print messages regarding server/internet connection status, file availability etc. Returns ------- coastlines : instance of <pygplates.FeatureCollection> Present-day global coastline Shapely polylines cookie-cut using static polygons. Ready for reconstruction to a particular geological time and for plotting. continents : instance of <pygplates.FeatureCollection> Cookie-cutting Shapely polygons for non-oceanic regions (continents, inta-oceanic arcs, etc.) ready for reconstruction to a particular geological time and for plotting. COBs : instance of <pygplates.FeatureCollection> Shapely polylines resolved from .shp and/or .gpml topology files that represent the locations of the boundaries between oceanic and continental crust. Ready for reconstruction to a particular geological time and for plotting. Notes ----- This method accesses the plate reconstruction model ascribed to the `file_collection` string passed into the `DataServer` object. For example, if the object was called with `"Muller2019"`: gDownload = gplately.download.DataServer("Muller2019") coastlines, continents, COBs = gDownload.get_topology_geometries() the method will attempt to download `coastlines`, `continents` and `COBs` from the Müller et al. (2019) plate reconstruction model. If found, these files are returned as individual pyGPlates Feature Collections. They can be passed into: gPlot = gplately.plot.PlotTopologies(gplately.reconstruction.PlateReconstruction, time, continents, coastlines, COBs) to reconstruct features to a certain geological time. The `PlotTopologies` object provides simple methods to plot these geometries along with trenches, ridges and transforms (see documentation for more info). Note that the `PlateReconstruction` object is a parameter. * Note: If the requested plate model does not have a certain geometry, a message will be printed to alert the user. For example, if `get_topology_geometries()` is used with the `"Matthews2016"` plate model, the workflow will print the following message: No continent-ocean boundaries in Matthews2016. """ return self.coastlines, self.continents, self.COBs def get_age_grid(self, times): """Downloads seafloor and paleo-age grids from the plate reconstruction model (`file_collection`) passed into the `DataServer` object. Stores grids in the "gplately" cache. Currently, `DataServer` supports the following age grids: * __Muller et al. 2019__ * `file_collection` = `Muller2019` * Time range: 0-250 Ma * Seafloor age grid rasters in netCDF format. * __Muller et al. 2016__ * `file_collection` = `Muller2016` * Time range: 0-240 Ma * Seafloor age grid rasters in netCDF format. * __Seton et al. 2012__ * `file_collection` = `Seton2012` * Time range: 0-200 Ma * Paleo-age grid rasters in netCDF format. Parameters ---------- times : int, or list of int, default=None Request an age grid from one (an integer) or multiple reconstruction times (a list of integers). Returns ------- a gplately.Raster object A gplately.Raster object containing the age grid. The age grid data can be extracted into a numpy ndarray or MaskedArray by appending `.data` to the variable assigned to `get_age_grid()`. For example: gdownload = gplately.DataServer("Muller2019") graster = gdownload.get_age_grid(time=100) graster_data = graster.data where `graster_data` is a numpy ndarray. Raises ----- ValueError If `time` (a single integer, or a list of integers representing reconstruction times to extract the age grids from) is not passed. Notes ----- The first time that `get_age_grid` is called for a specific time(s), the age grid(s) will be downloaded into the GPlately cache once. Upon successive calls of `get_age_grid` for the same reconstruction time(s), the age grids will not be re-downloaded; rather, they are re-accessed from the same cache provided the age grid(s) have not been moved or deleted. Examples -------- if the `DataServer` object was called with the `Muller2019` `file_collection` string: gDownload = gplately.download.DataServer("Muller2019") `get_age_grid` will download seafloor age grids from the Müller et al. (2019) plate reconstruction model for the geological time(s) requested in the `time` parameter. If found, these age grids are returned as masked arrays. For example, to download Müller et al. (2019) seafloor age grids for 0Ma, 1Ma and 100 Ma: age_grids = gDownload.get_age_grid([0, 1, 100]) """ if not self.pmm: raise Exception("The plate model object is None. Unable to get agegrid.") if "AgeGrids" not in self.pmm.get_cfg()["TimeDepRasters"]: raise ValueError( "AgeGrids are not currently available for {}".format( self.file_collection ) ) age_grids = [] time_array = np.atleast_1d(times) if time_array.min() < self.to_age or time_array.max() > self.from_age: raise ValueError("Specify a time range between {}".format(self.time_range)) for ti in time_array: agegrid_filename = self.pmm.get_raster("AgeGrids", ti) agegrid = _gplately.grids.Raster(data=agegrid_filename) age_grids.append(agegrid) if len(age_grids) == 1: return age_grids[0] else: return age_grids def get_spreading_rate_grid(self, times): """Downloads seafloor spreading rate grids from the plate reconstruction model (`file_collection`) passed into the `DataServer` object. Stores grids in the "gplately" cache. Currently, `DataServer` supports spreading rate grids from the following plate models: * __Clennett et al. 2020__ * `file_collection` = `Clennett2020` * Time range: 0-250 Ma * Seafloor spreading rate grids in netCDF format. Parameters ---------- time : int, or list of int, default=None Request a spreading grid from one (an integer) or multiple reconstruction times (a list of integers). Returns ------- a gplately.Raster object A gplately.Raster object containing the spreading rate grid. The spreading rate grid data can be extracted into a numpy ndarray or MaskedArray by appending `.data` to the variable assigned to `get_spreading_rate_grid()`. For example: gdownload = gplately.DataServer("Clennett2020") graster = gdownload.get_spreading_rate_grid(time=100) graster_data = graster.data where `graster_data` is a numpy ndarray. Raises ----- ValueError If `time` (a single integer, or a list of integers representing reconstruction times to extract the spreading rate grids from) is not passed. Notes ----- The first time that `get_spreading_rate_grid` is called for a specific time(s), the spreading rate grid(s) will be downloaded into the GPlately cache once. Upon successive calls of `get_spreading_rate_grid` for the same reconstruction time(s), the grids will not be re-downloaded; rather, they are re-accessed from the same cache location provided they have not been moved or deleted. Examples -------- if the `DataServer` object was called with the `Clennett2020` `file_collection` string: gDownload = gplately.download.DataServer("Clennett2020") `get_spreading_rate_grid` will download seafloor spreading rate grids from the Clennett et al. (2020) plate reconstruction model for the geological time(s) requested in the `time` parameter. When found, these spreading rate grids are returned as masked arrays. For example, to download Clennett et al. (2020) seafloor spreading rate grids for 0Ma, 1Ma and 100 Ma as MaskedArray objects: spreading_rate_grids = gDownload.get_spreading_rate_grid([0, 1, 100]) """ if not self.pmm: raise Exception( "The plate model object is None. Unable to get spreading rate grids." ) if "SpreadingRateGrids" not in self.pmm.get_cfg()["TimeDepRasters"]: raise ValueError( "SpreadingRateGrids are not currently available for {}".format( self.file_collection ) ) spread_grids = [] time_array = np.atleast_1d(times) if time_array.min() < self.to_age or time_array.max() > self.from_age: raise ValueError("Specify a time range between {}".format(self.time_range)) for ti in time_array: spreadgrid_filename = self.pmm.get_raster("SpreadingRateGrids", ti) spreadgrid = _gplately.grids.Raster(data=spreadgrid_filename) spread_grids.append(spreadgrid) if len(spread_grids) == 1: return spread_grids[0] else: return spread_grids def get_valid_times(self): """Returns a tuple of the valid plate model time range, (max_time, min_time).""" return self.from_age, self.to_age def get_raster(self, raster_id_string=None): """Downloads assorted raster data that are not associated with the plate reconstruction models supported by GPlately's `DataServer`. Stores rasters in the "gplately" cache. Currently, `DataServer` supports the following rasters and images: * __[ETOPO1](https://www.ngdc.noaa.gov/mgg/global/)__: * Filetypes available : TIF, netCDF (GRD) * `raster_id_string` = `"ETOPO1_grd"`, `"ETOPO1_tif"` (depending on the requested format) * A 1-arc minute global relief model combining lang topography and ocean bathymetry. * Citation: doi:10.7289/V5C8276M Parameters ---------- raster_id_string : str, default=None A string to identify which raster to download. Returns ------- a gplately.Raster object A gplately.Raster object containing the raster data. The gridded data can be extracted into a numpy ndarray or MaskedArray by appending `.data` to the variable assigned to `get_raster()`. For example: gdownload = gplately.DataServer("Muller2019") graster = gdownload.get_raster(raster_id_string, verbose) graster_data = graster.data where `graster_data` is a numpy ndarray. This array can be visualised using `matplotlib.pyplot.imshow` on a `cartopy.mpl.GeoAxis` GeoAxesSubplot (see example below). Raises ------ ValueError * if a `raster_id_string` is not supplied. Notes ----- Rasters obtained by this method are (so far) only reconstructed to present-day. Examples -------- To download ETOPO1 and plot it on a Mollweide projection: import gplately import numpy as np import matplotlib.pyplot as plt import cartopy.crs as ccrs gdownload = gplately.DataServer("Muller2019") etopo1 = gdownload.get_raster("ETOPO1_tif") fig = plt.figure(figsize=(18,14), dpi=300) ax = fig.add_subplot(111, projection=ccrs.Mollweide(central_longitude = -150)) ax2.imshow(etopo1, extent=[-180,180,-90,90], transform=ccrs.PlateCarree()) """ if raster_id_string: raster_path = PresentDayRasterManager().get_raster(raster_id_string) if raster_path.endswith(".grd") or raster_path.endswith(".nc"): raster = _gplately.grids.Raster(data=raster_path) # Otherwise, the raster is an image; use imread to process else: from matplotlib import image raster_matrix = image.imread(raster_path) raster = _gplately.grids.Raster(data=raster_matrix) if raster_id_string.lower() == "etopo1_tif": raster.lats = raster.lats[::-1] if raster_id_string.lower() == "etopo1_grd": raster._data = raster._data.astype(float) # type: ignore return raster def get_feature_data(self, feature_data_id_string=None): """Downloads assorted geological feature data from web servers (i.e. [GPlates 2.3 sample data](https://www.earthbyte.org/gplates-2-3-software-and-data-sets/)) into the "gplately" cache. Currently, `DataServer` supports the following feature data: * __Large igneous provinces from Johansson et al. (2018)__ Information ----------- * Formats: .gpmlz * `feature_data_id_string` = `Johansson2018` Citations --------- * Johansson, L., Zahirovic, S., and Müller, R. D., In Prep, The interplay between the eruption and weathering of Large Igneous Provinces and the deep-time carbon cycle: Geophysical Research Letters. - __Large igneous province products interpreted as plume products from Whittaker et al. (2015)__. Information ----------- * Formats: .gpmlz, .shp * `feature_data_id_string` = `Whittaker2015` Citations --------- * Whittaker, J. M., Afonso, J. C., Masterton, S., Müller, R. D., Wessel, P., Williams, S. E., & Seton, M. (2015). Long-term interaction between mid-ocean ridges and mantle plumes. Nature Geoscience, 8(6), 479-483. doi:10.1038/ngeo2437. - __Seafloor tectonic fabric (fracture zones, discordant zones, V-shaped structures, unclassified V-anomalies, propagating ridge lineations and extinct ridges) from Matthews et al. (2011)__ Information ----------- * Formats: .gpml * `feature_data_id_string` = `SeafloorFabric` Citations --------- * Matthews, K.J., Müller, R.D., Wessel, P. and Whittaker, J.M., 2011. The tectonic fabric of the ocean basins. Journal of Geophysical Research, 116(B12): B12109, DOI: 10.1029/2011JB008413. - __Present day surface hotspot/plume locations from Whittaker et al. (2013)__ Information ----------- * Formats: .gpmlz * `feature_data_id_string` = `Hotspots` Citation -------- * Whittaker, J., Afonso, J., Masterton, S., Müller, R., Wessel, P., Williams, S., and Seton, M., 2015, Long-term interaction between mid-ocean ridges and mantle plumes: Nature Geoscience, v. 8, no. 6, p. 479-483, doi:10.1038/ngeo2437. Parameters ---------- feature_data_id_string : str, default=None A string to identify which feature data to download to the cache (see list of supported feature data above). Returns ------- feature_data_filenames : instance of <pygplates.FeatureCollection>, or list of instance <pygplates.FeatureCollection> If a single set of feature data is downloaded, a single pyGPlates `FeatureCollection` object is returned. Otherwise, a list containing multiple pyGPlates `FeatureCollection` objects is returned (like for `SeafloorFabric`). In the latter case, feature reconstruction and plotting may have to be done iteratively. Raises ------ ValueError If a `feature_data_id_string` is not provided. Examples -------- For examples of plotting data downloaded with `get_feature_data`, see GPlately's sample notebook 05 - Working With Feature Geometries [here](https://github.com/GPlates/gplately/blob/master/Notebooks/05-WorkingWithFeatureGeometries.ipynb). """ if feature_data_id_string is None: raise ValueError("Please specify which feature data to fetch.") database = _gplately.data._feature_data() found_collection = False for collection, zip_url in database.items(): if feature_data_id_string.lower() == collection.lower(): found_collection = True feature_data_filenames = _collection_sorter( _collect_file_extension( download_from_web(zip_url[0], self.verbose), [".gpml", ".gpmlz"] ), collection, ) break if found_collection is False: raise ValueError( "{} are not in GPlately's DataServer.".format(feature_data_id_string) ) feat_data = _pygplates.FeatureCollection() if len(feature_data_filenames) == 1: feat_data.add(_pygplates.FeatureCollection(feature_data_filenames[0])) return feat_data else: feat_data = [] for file in feature_data_filenames: feat_data.append(_pygplates.FeatureCollection(file)) return feat_dataInstance variables
prop COBs-
Expand source code
@property
def COBs(self):
    if self._COBs is None and self.pmm:
        if "COBs" in self._available_layers:
            self._COBs = self._create_feature_collection(self.pmm.get_COBs())
        else:
            self._COBs = []
    return self._COBs
prop coastlines-
Expand source code
@property
def coastlines(self):
    if self._coastlines is None and self.pmm:
        if "Coastlines" in self._available_layers:
            self._coastlines = self._create_feature_collection(
                self.pmm.get_coastlines()
            )
        else:
            self._coastlines = []
    return self._coastlines
prop continents-
Expand source code
@property
def continents(self):
    if self._continents is None and self.pmm:
        if "ContinentalPolygons" in self._available_layers:
            self._continents = self._create_feature_collection(
                self.pmm.get_continental_polygons()
            )
        else:
            self._continents = []
    return self._continents
prop from_age-
Expand source code
@property
def from_age(self):
    if self.pmm:
        return self.pmm.get_big_time()
prop rotation_model-
Expand source code
@property
def rotation_model(self):
    if self._rotation_model is None and self.pmm:
        self._rotation_model = _pygplates.RotationModel(
            self.pmm.get_rotation_model()
        )
        self._rotation_model.reconstruction_identifier = self.file_collection
    return self._rotation_model
prop static_polygons-
Expand source code
@property
def static_polygons(self):
    if self._static_polygons is None and self.pmm:
        if "StaticPolygons" in self._available_layers:
            self._static_polygons = self._create_feature_collection(
                self.pmm.get_static_polygons()
            )
        else:
            self._static_polygons = []
    return self._static_polygons
prop time_range-
Expand source code
@property
def time_range(self):
    return self.from_age, self.to_age
prop to_age-
Expand source code
@property
def to_age(self):
    if self.pmm:
        return self.pmm.get_small_time()
prop topology_features-
Expand source code
@property
def topology_features(self):
    if self._topology_features is None and self.pmm:
        if "Topologies" in self._available_layers:
            self._topology_features = self._create_feature_collection(
                self.pmm.get_topologies()
            )
        else:
            self._topology_features = []
    return self._topology_features
prop valid_times-
Expand source code
@property
def valid_times(self):
    return self.from_age, self.to_age
Methods
def get_age_grid(self, times)-
Downloads seafloor and paleo-age grids from the plate reconstruction model (
file_collection) passed into theDataServerobject. Stores grids in the "gplately" cache.Currently,
DataServersupports the following age grids:-
Muller et al. 2019
file_collection=Muller2019- Time range: 0-250 Ma
- Seafloor age grid rasters in netCDF format.
-
Muller et al. 2016
file_collection=Muller2016- Time range: 0-240 Ma
- Seafloor age grid rasters in netCDF format.
-
Seton et al. 2012
file_collection=Seton2012- Time range: 0-200 Ma
- Paleo-age grid rasters in netCDF format.
Parameters
times:int,orlistofint, default=None- Request an age grid from one (an integer) or multiple reconstruction times (a list of integers).
Returns
a Raster object-
A gplately.Raster object containing the age grid. The age grid data can be extracted into a numpy ndarray or MaskedArray by appending
.datato the variable assigned toget_age_grid().For example:
gdownload = gplately.DataServer("Muller2019")

graster = gdownload.get_age_grid(time=100)

graster_data = graster.data
where
graster_datais a numpy ndarray.
Raises
ValueError- If
time(a single integer, or a list of integers representing reconstruction times to extract the age grids from) is not passed.
Notes
The first time that
get_age_gridis called for a specific time(s), the age grid(s) will be downloaded into the GPlately cache once. Upon successive calls ofget_age_gridfor the same reconstruction time(s), the age grids will not be re-downloaded; rather, they are re-accessed from the same cache provided the age grid(s) have not been moved or deleted.Examples
if the
DataServerobject was called with theMuller2019file_collectionstring:gDownload = gplately.download.DataServer("Muller2019")get_age_gridwill download seafloor age grids from the Müller et al. (2019) plate reconstruction model for the geological time(s) requested in thetimeparameter. If found, these age grids are returned as masked arrays.For example, to download Müller et al. (2019) seafloor age grids for 0Ma, 1Ma and 100 Ma:
age_grids = gDownload.get_age_grid([0, 1, 100]) -
def get_feature_data(self, feature_data_id_string=None)-
Downloads assorted geological feature data from web servers (i.e. GPlates 2.3 sample data) into the "gplately" cache.
Currently,
DataServersupports the following feature data:-
Large igneous provinces from Johansson et al. (2018)
Information
- Formats: .gpmlz
feature_data_id_string=Johansson2018
Citations
- Johansson, L., Zahirovic, S., and Müller, R. D., In Prep, The interplay between the eruption and weathering of Large Igneous Provinces and the deep-time carbon cycle: Geophysical Research Letters.
-
Large igneous province products interpreted as plume products from Whittaker et al. (2015).
Information
- Formats: .gpmlz, .shp
feature_data_id_string=Whittaker2015
Citations
- Whittaker, J. M., Afonso, J. C., Masterton, S., Müller, R. D., Wessel, P., Williams, S. E., & Seton, M. (2015). Long-term interaction between mid-ocean ridges and mantle plumes. Nature Geoscience, 8(6), 479-483. doi:10.1038/ngeo2437.
-
Seafloor tectonic fabric (fracture zones, discordant zones, V-shaped structures, unclassified V-anomalies, propagating ridge lineations and extinct ridges) from Matthews et al. (2011)
Information
- Formats: .gpml
feature_data_id_string=SeafloorFabric
Citations
- Matthews, K.J., Müller, R.D., Wessel, P. and Whittaker, J.M., 2011. The tectonic fabric of the ocean basins. Journal of Geophysical Research, 116(B12): B12109, DOI: 10.1029/2011JB008413.
-
Present day surface hotspot/plume locations from Whittaker et al. (2013)
Information
- Formats: .gpmlz
feature_data_id_string=Hotspots
Citation
- Whittaker, J., Afonso, J., Masterton, S., Müller, R., Wessel, P., Williams, S., and Seton, M., 2015, Long-term interaction between mid-ocean ridges and mantle plumes: Nature Geoscience, v. 8, no. 6, p. 479-483, doi:10.1038/ngeo2437.
Parameters
feature_data_id_string:str, default=None- A string to identify which feature data to download to the cache (see list of supported feature data above).
Returns
feature_data_filenames:instanceof<pygplates.FeatureCollection>,orlistofinstance <pygplates.FeatureCollection>- If a single set of feature data is downloaded, a single pyGPlates
FeatureCollectionobject is returned. Otherwise, a list containing multiple pyGPlatesFeatureCollectionobjects is returned (like forSeafloorFabric). In the latter case, feature reconstruction and plotting may have to be done iteratively.
Raises
ValueError- If a
feature_data_id_stringis not provided.
Examples
For examples of plotting data downloaded with
get_feature_data, see GPlately's sample notebook 05 - Working With Feature Geometries here. -
def get_plate_reconstruction_files(self)-
Downloads and constructs a
rotation model, a set oftopology featuresand and a set ofstatic polygons. These objects can then be used to createPlateReconstructionobject.Returns
rotation_model:instanceof<pygplates.RotationModel>- A rotation model to query equivalent and/or relative topological plate rotations from a time in the past relative to another time in the past or to present day.
topology_features:instanceof<pygplates.FeatureCollection>- Point, polyline and/or polygon feature data that are reconstructable through geological time.
static_polygons:instanceof<pygplates.FeatureCollection>- Present-day polygons whose shapes do not change through geological time. They are used to cookie-cut dynamic polygons into identifiable topological plates (assigned an ID) according to their present-day locations.
Notes
The get_plate_reconstruction_files() method downloads reconstruction files from a given plate model. For example,
gDownload = gplately.download.DataServer("Muller2019")
rotation_model, topology_features, static_polygons = gDownload.get_plate_reconstruction_files()
The code above downloads
rotation model,topology featuresandstatic polygonsfiles from the Müller et al. (2019) plate reconstruction model. These files can then be used to createPlateReconstructionobject.model = gplately.reconstruction.PlateReconstruction(rotation_model, topology_features, static_polygons)If the requested plate model does not have certain file(s), a warning message will alert user of the missing file(s).
def get_raster(self, raster_id_string=None)-
Downloads assorted raster data that are not associated with the plate reconstruction models supported by GPlately's
DataServer. Stores rasters in the "gplately" cache.Currently,
DataServersupports the following rasters and images:- ETOPO1:
- Filetypes available : TIF, netCDF (GRD)
raster_id_string="ETOPO1_grd","ETOPO1_tif"(depending on the requested format)- A 1-arc minute global relief model combining lang topography and ocean bathymetry.
- Citation: doi:10.7289/V5C8276M
Parameters
raster_id_string:str, default=None- A string to identify which raster to download.
Returns
a Raster object-
A gplately.Raster object containing the raster data. The gridded data can be extracted into a numpy ndarray or MaskedArray by appending
.datato the variable assigned toget_raster().For example:
gdownload = gplately.DataServer("Muller2019")

graster = gdownload.get_raster(raster_id_string, verbose)

graster_data = graster.data
where
graster_datais a numpy ndarray. This array can be visualised usingmatplotlib.pyplot.imshowon acartopy.mpl.GeoAxisGeoAxesSubplot (see example below).
Raises
ValueError-
- if a
raster_id_stringis not supplied.
- if a
Notes
Rasters obtained by this method are (so far) only reconstructed to present-day.
Examples
To download ETOPO1 and plot it on a Mollweide projection:
import gplately import numpy as np import matplotlib.pyplot as plt import cartopy.crs as ccrs gdownload = gplately.DataServer("Muller2019") etopo1 = gdownload.get_raster("ETOPO1_tif") fig = plt.figure(figsize=(18,14), dpi=300) ax = fig.add_subplot(111, projection=ccrs.Mollweide(central_longitude = -150)) ax2.imshow(etopo1, extent=[-180,180,-90,90], transform=ccrs.PlateCarree()) - ETOPO1:
def get_spreading_rate_grid(self, times)-
Downloads seafloor spreading rate grids from the plate reconstruction model (
file_collection) passed into theDataServerobject. Stores grids in the "gplately" cache.Currently,
DataServersupports spreading rate grids from the following plate models:-
Clennett et al. 2020
file_collection=Clennett2020- Time range: 0-250 Ma
- Seafloor spreading rate grids in netCDF format.
Parameters
time:int,orlistofint, default=None- Request a spreading grid from one (an integer) or multiple reconstruction times (a list of integers).
Returns
a Raster object-
A gplately.Raster object containing the spreading rate grid. The spreading rate grid data can be extracted into a numpy ndarray or MaskedArray by appending
.datato the variable assigned toget_spreading_rate_grid().For example:
gdownload = gplately.DataServer("Clennett2020")

graster = gdownload.get_spreading_rate_grid(time=100)

graster_data = graster.data
where
graster_datais a numpy ndarray.
Raises
ValueError- If
time(a single integer, or a list of integers representing reconstruction times to extract the spreading rate grids from) is not passed.
Notes
The first time that
get_spreading_rate_gridis called for a specific time(s), the spreading rate grid(s) will be downloaded into the GPlately cache once. Upon successive calls ofget_spreading_rate_gridfor the same reconstruction time(s), the grids will not be re-downloaded; rather, they are re-accessed from the same cache location provided they have not been moved or deleted.Examples
if the
DataServerobject was called with theClennett2020file_collectionstring:gDownload = gplately.download.DataServer("Clennett2020")get_spreading_rate_gridwill download seafloor spreading rate grids from the Clennett et al. (2020) plate reconstruction model for the geological time(s) requested in thetimeparameter. When found, these spreading rate grids are returned as masked arrays.For example, to download Clennett et al. (2020) seafloor spreading rate grids for 0Ma, 1Ma and 100 Ma as MaskedArray objects:
spreading_rate_grids = gDownload.get_spreading_rate_grid([0, 1, 100]) -
def get_topology_geometries(self)-
Uses the plate-model-manager to download coastline, continent and COB (continent-ocean boundary) Shapely geometries from the requested plate model. These are needed to call the
PlotTopologiesobject and visualise topological plates through time.Parameters
verbose:bool, defaultTrue- Toggle print messages regarding server/internet connection status, file availability etc.
Returns
coastlines:instanceof<pygplates.FeatureCollection>- Present-day global coastline Shapely polylines cookie-cut using static polygons. Ready for reconstruction to a particular geological time and for plotting.
continents:instanceof<pygplates.FeatureCollection>- Cookie-cutting Shapely polygons for non-oceanic regions (continents, inta-oceanic arcs, etc.) ready for reconstruction to a particular geological time and for plotting.
COBs:instanceof<pygplates.FeatureCollection>- Shapely polylines resolved from .shp and/or .gpml topology files that represent the locations of the boundaries between oceanic and continental crust. Ready for reconstruction to a particular geological time and for plotting.
Notes
This method accesses the plate reconstruction model ascribed to the
file_collectionstring passed into theDataServerobject. For example, if the object was called with"Muller2019":gDownload = gplately.download.DataServer("Muller2019") coastlines, continents, COBs = gDownload.get_topology_geometries()the method will attempt to download
coastlines,continentsandCOBsfrom the Müller et al. (2019) plate reconstruction model. If found, these files are returned as individual pyGPlates Feature Collections. They can be passed into:gPlot = gplately.plot.PlotTopologies(gplately.reconstruction.PlateReconstruction, time, continents, coastlines, COBs)to reconstruct features to a certain geological time. The
PlotTopologiesobject provides simple methods to plot these geometries along with trenches, ridges and transforms (see documentation for more info). Note that thePlateReconstructionobject is a parameter.- Note: If the requested plate model does not have a certain geometry, a
message will be printed to alert the user. For example, if
get_topology_geometries()is used with the"Matthews2016"plate model, the workflow will print the following message:No continent-ocean boundaries in Matthews2016.
def get_valid_times(self)-
Returns a tuple of the valid plate model time range, (max_time, min_time).
class PlateReconstruction (rotation_model, topology_features=None, static_polygons=None, anchor_plate_id=None, plate_model_name: str = 'Nemo')-
The
PlateReconstructionclass contains methods to reconstruct topology features to specific geological times given arotation_model, a set oftopology_featuresand a set ofstatic_polygons. Topological plate velocity data at specific geological times can also be calculated from these reconstructed features.Attributes
rotation_model:pygplates.RotationModel- A rotation model to query equivalent and/or relative topological plate rotations from a time in the past relative to another time in the past or to present day.
topology_features:pygplates.FeatureCollection, defaultNone- Topological features like trenches, ridges and transforms.
static_polygons:pygplates.FeatureCollection, defaultNone- Present-day polygons whose shapes do not change through geological time when reconstructed.
anchor_plate_id:int- Anchor plate ID for reconstruction.
Parameters
rotation_model:str/os.PathLike,orinstanceof<pygplates.FeatureCollection>,or<pygplates.Feature>,orsequenceof<pygplates.Feature>,orinstanceof<pygplates.RotationModel>- A rotation model to query equivalent and/or relative topological plate rotations from a time in the past relative to another time in the past or to present day. Can be provided as a rotation filename, or rotation feature collection, or rotation feature, or sequence of rotation features, or a sequence (eg, a list or tuple) of any combination of those four types.
topology_features:str/os.PathLike,ora sequence (eg,listortuple)ofinstancesof<pygplates.Feature>,ora single instanceof<pygplates.Feature>,oran instanceof<pygplates.FeatureCollection>, defaultNone- Reconstructable topological features like trenches, ridges and transforms. Can be provided as an optional topology-feature filename, or sequence of features, or a single feature.
static_polygons:str/os.PathLike,orinstanceof<pygplates.Feature>,orsequenceof<pygplates.Feature>,or an instanceof<pygplates.FeatureCollection>, defaultNone- Present-day polygons whose shapes do not change through geological time. They are used to cookie-cut dynamic polygons into identifiable topological plates (assigned an ID) according to their present-day locations. Can be provided as a static polygon feature collection, or optional filename, or a single feature, or a sequence of features.
anchor_plate_id:int, optional- Default anchor plate ID for reconstruction.
If not specified then uses the default anchor plate of
rotation_modelif it's apygplates.RotationModel(otherwise uses zero).
Expand source code
class PlateReconstruction(object): """The `PlateReconstruction` class contains methods to reconstruct topology features to specific geological times given a `rotation_model`, a set of `topology_features` and a set of `static_polygons`. Topological plate velocity data at specific geological times can also be calculated from these reconstructed features. Attributes ---------- rotation_model : `pygplates.RotationModel` A rotation model to query equivalent and/or relative topological plate rotations from a time in the past relative to another time in the past or to present day. topology_features : `pygplates.FeatureCollection`, default None Topological features like trenches, ridges and transforms. static_polygons : `pygplates.FeatureCollection`, default None Present-day polygons whose shapes do not change through geological time when reconstructed. anchor_plate_id : int Anchor plate ID for reconstruction. """ def __init__( self, rotation_model, topology_features=None, static_polygons=None, anchor_plate_id=None, plate_model_name: str = "Nemo", ): """ Parameters ---------- rotation_model : str/`os.PathLike`, or instance of <pygplates.FeatureCollection>, or <pygplates.Feature>, or sequence of <pygplates.Feature>, or instance of <pygplates.RotationModel> A rotation model to query equivalent and/or relative topological plate rotations from a time in the past relative to another time in the past or to present day. Can be provided as a rotation filename, or rotation feature collection, or rotation feature, or sequence of rotation features, or a sequence (eg, a list or tuple) of any combination of those four types. topology_features : str/`os.PathLike`, or a sequence (eg, `list` or `tuple`) of instances of <pygplates.Feature>, or a single instance of <pygplates.Feature>, or an instance of <pygplates.FeatureCollection>, default None Reconstructable topological features like trenches, ridges and transforms. Can be provided as an optional topology-feature filename, or sequence of features, or a single feature. static_polygons : str/`os.PathLike`, or instance of <pygplates.Feature>, or sequence of <pygplates.Feature>,or an instance of <pygplates.FeatureCollection>, default None Present-day polygons whose shapes do not change through geological time. They are used to cookie-cut dynamic polygons into identifiable topological plates (assigned an ID) according to their present-day locations. Can be provided as a static polygon feature collection, or optional filename, or a single feature, or a sequence of features. anchor_plate_id : int, optional Default anchor plate ID for reconstruction. If not specified then uses the default anchor plate of `rotation_model` if it's a `pygplates.RotationModel` (otherwise uses zero). """ # Add a warning if the rotation_model is empty if not rotation_model: logger.warning( "No rotation features were passed to the constructor of PlateReconstruction. The reconstruction will not work. Check your rotation file(s)." ) if hasattr(rotation_model, "reconstruction_identifier"): self.name = rotation_model.reconstruction_identifier else: self.name = None if anchor_plate_id is None: if isinstance(rotation_model, pygplates.RotationModel): # Use the default anchor plate of 'rotation_model'. self.rotation_model = rotation_model else: # Using rotation features/files, so default anchor plate is 0. self.rotation_model = pygplates.RotationModel(rotation_model) else: # User has explicitly specified an anchor plate ID, so let's check it. anchor_plate_id = self._check_anchor_plate_id(anchor_plate_id) # This works when 'rotation_model' is a RotationModel or rotation features/files. self.rotation_model = pygplates.RotationModel( rotation_model, default_anchor_plate_id=anchor_plate_id ) self.topology_features = _load_FeatureCollection(topology_features) self.static_polygons = _load_FeatureCollection(static_polygons) self.plate_model_name = plate_model_name # Keep a snapshot of the resolved topologies at its last requested snapshot time (and anchor plate). # Also keep a snapshot of the reconstructed static polygons at its the last requested snapshot time (and anchor plate) # which, by the way, could be a different snapshot time and anchor plate than the topological snapshot. # # This avoids having to do unnessary work if the same snapshot time (and anchor plate) is requested again. # But if the requested time (or anchor plate) changes then we'll create a new snapshot. # # Note: Both pygplates.TopologicalSnapshot and pygplates.ReconstructSnapshot can be pickled. self._topological_snapshot = None self._static_polygons_snapshot = None def __getstate__(self): state = self.__dict__.copy() # Remove the unpicklable entries. # # This includes pygplates reconstructed feature geometries and resolved topological geometries. # Note: PyGPlates features and features collections (and rotation models) can be pickled though. # return state def __setstate__(self, state): self.__dict__.update(state) # Restore the unpicklable entries. # # This includes pygplates reconstructed feature geometries and resolved topological geometries. # Note: PyGPlates features and features collections (and rotation models) can be pickled though. # @property def anchor_plate_id(self): """Anchor plate ID for reconstruction. Must be an integer >= 0.""" # The default anchor plate comes from the RotationModel. return self.rotation_model.get_default_anchor_plate_id() @anchor_plate_id.setter def anchor_plate_id(self, anchor_plate): # Note: Caller cannot specify None when setting the anchor plate. anchor_plate = self._check_anchor_plate_id(anchor_plate) # Only need to update if the anchor plate changed. if anchor_plate != self.anchor_plate_id: # Update the RotationModel (which is where the anchor plate is stored). # This keeps the same rotation model but just changes the anchor plate. self.rotation_model = pygplates.RotationModel( self.rotation_model, default_anchor_plate_id=anchor_plate ) @staticmethod def _check_anchor_plate_id(id): id = int(id) if id < 0: raise ValueError("Invalid anchor plate ID: {}".format(id)) return id def _check_topology_features(self, *, include_topological_slab_boundaries=True): if self.topology_features is None: raise ValueError( "Topology features have not been set in this PlateReconstruction." ) # If not including topological slab boundaries then remove them. if not include_topological_slab_boundaries: return [ feature for feature in self.topology_features if feature.get_feature_type() != pygplates.FeatureType.gpml_topological_slab_boundary ] return self.topology_features def topological_snapshot( self, time, *, anchor_plate_id=None, include_topological_slab_boundaries=True ): """Create a snapshot of resolved topologies at the specified reconstruction time. This returns a [pygplates.TopologicalSnapshot](https://www.gplates.org/docs/pygplates/generated/pygplates.TopologicalSnapshot) from which you can extract resolved topologies, calculate velocities at point locations, calculate plate boundary statistics, etc. Parameters ---------- time : float, int or pygplates.GeoTimeInstant The geological time at which to create the topological snapshot. anchor_plate_id : int, optional The anchored plate id to use when resolving topologies. If not specified then uses the current anchor plate (`anchor_plate_id` attribute). include_topological_slab_boundaries : bool, default=True Include topological boundary features of type `gpml:TopologicalSlabBoundary`. By default all features passed into constructor (`__init__`) are included in the snapshot. However setting this to False is useful when you're only interested in *plate* boundaries. Returns ------- topological_snapshot : `pygplates.TopologicalSnapshot` The [topological snapshot](https://www.gplates.org/docs/pygplates/generated/pygplates.TopologicalSnapshot) at the specified `time` (and anchor plate). Raises ------ ValueError If topology features have not been set in this `PlateReconstruction`. """ if anchor_plate_id is None: anchor_plate_id = self.anchor_plate_id # Only need to create a new snapshot if we don't have one, or if any of the following have changed since the last snapshot: # - the reconstruction time, # - the anchor plate, # - whether to include topological slab boundaries or not. if ( self._topological_snapshot is None # last snapshot time... or self._topological_snapshot.get_reconstruction_time() # use pygplates.GeoTimeInstant to get a numerical tolerance in floating-point time comparison... != pygplates.GeoTimeInstant(time) # last snapshot anchor plate... or self._topological_snapshot.get_rotation_model().get_default_anchor_plate_id() != anchor_plate_id # whether last snapshot included topological slab boundaries... or self._topological_snapshot_includes_topological_slab_boundaries != include_topological_slab_boundaries ): # Create snapshot for current parameters. self._topological_snapshot = pygplates.TopologicalSnapshot( self._check_topology_features( include_topological_slab_boundaries=include_topological_slab_boundaries ), self.rotation_model, time, anchor_plate_id=anchor_plate_id, ) # Parameters used for the last snapshot. # # The snapshot time and anchor plate are stored in the snapshot itself (so not added here). # # Note: These don't need to be initialised in '__init__()' as long as it sets "self._topological_snapshot = None". # # Note: If we add more parameters then perhaps create a single nested private (leading '_') class for them. self._topological_snapshot_includes_topological_slab_boundaries = ( include_topological_slab_boundaries ) return self._topological_snapshot def _check_static_polygons(self): # Check we have static polygons. # # Currently all available models have them, but it's possible for a user to create a PlateReconstruction without them. if self.static_polygons is None: raise ValueError( "Static polygons have not been set in this PlateReconstruction." ) return self.static_polygons def static_polygons_snapshot(self, time, *, anchor_plate_id=None): """Create a reconstructed snapshot of the static polygons at the specified reconstruction time. This returns a [pygplates.ReconstructSnapshot](https://www.gplates.org/docs/pygplates/generated/pygplates.ReconstructSnapshot) from which you can extract reconstructed static polygons, find reconstructed polygons containing points and calculate velocities at point locations, etc. Parameters ---------- time : float, int or pygplates.GeoTimeInstant The geological time at which to create the reconstructed static polygons snapshot. anchor_plate_id : int, optional The anchored plate id to use when reconstructing the static polygons. If not specified then uses the current anchor plate (`anchor_plate_id` attribute). Returns ------- static_polygons_snapshot : `pygplates.ReconstructSnapshot` The reconstructed static polygons [snapshot](https://www.gplates.org/docs/pygplates/generated/pygplates.ReconstructSnapshot) at the specified `time` (and anchor plate). Raises ------ ValueError If static polygons have not been set in this `PlateReconstruction`. """ if anchor_plate_id is None: anchor_plate_id = self.anchor_plate_id # Only need to create a new snapshot if we don't have one, or if any of the following have changed since the last snapshot: # - the reconstruction time, # - the anchor plate. if ( self._static_polygons_snapshot is None # last snapshot time... or self._static_polygons_snapshot.get_reconstruction_time() # use pygplates.GeoTimeInstant to get a numerical tolerance in floating-point time comparison... != pygplates.GeoTimeInstant(time) # last snapshot anchor plate... or self._static_polygons_snapshot.get_rotation_model().get_default_anchor_plate_id() != anchor_plate_id ): # Create snapshot for current parameters. self._static_polygons_snapshot = pygplates.ReconstructSnapshot( self._check_static_polygons(), self.rotation_model, time, anchor_plate_id=anchor_plate_id, ) return self._static_polygons_snapshot def divergent_convergent_plate_boundaries( self, time, uniform_point_spacing_radians=0.001, divergence_velocity_threshold=0.0, convergence_velocity_threshold=0.0, *, first_uniform_point_spacing_radians=None, anchor_plate_id=None, velocity_delta_time=1.0, velocity_delta_time_type=pygplates.VelocityDeltaTimeType.t_plus_delta_t_to_t, velocity_units=pygplates.VelocityUnits.cms_per_yr, earth_radius_in_kms=pygplates.Earth.mean_radius_in_kms, include_network_boundaries=False, include_topological_slab_boundaries=False, boundary_section_filter=None, ): """Samples points uniformly along plate boundaries and calculates statistics at diverging/converging locations at a particular geological time. Resolves topologies at `time`, uniformly samples all plate boundaries into points and returns two lists of [pygplates.PlateBoundaryStatistic](https://www.gplates.org/docs/pygplates/generated/pygplates.PlateBoundaryStatistic). The first list represents sample points where the plates are diverging, and the second where plates are converging. Parameters ---------- time : float The reconstruction time (Ma) at which to query divergent/convergent plate boundaries. uniform_point_spacing_radians : float, default=0.001 The spacing between uniform points along plate boundaries (in radians). divergence_velocity_threshold : float, default=0.0 Orthogonal (ie, in the direction of boundary normal) velocity threshold for *diverging* sample points. Points with an orthogonal *diverging* velocity above this value will be returned in `diverging_data`. The default is `0.0` which removes all converging sample points (leaving only diverging points). This value can be negative which means a small amount of convergence is allowed for the diverging points. The units should match the units of `velocity_units` (eg, if that's cm/yr then this threshold should also be in cm/yr). convergence_velocity_threshold : float, default=0.0 Orthogonal (ie, in the direction of boundary normal) velocity threshold for *converging* sample points. Points with an orthogonal *converging* velocity above this value will be returned in `converging_data`. The default is `0.0` which removes all diverging sample points (leaving only converging points). This value can be negative which means a small amount of divergence is allowed for the converging points. The units should match the units of `velocity_units` (eg, if that's cm/yr then this threshold should also be in cm/yr). first_uniform_point_spacing_radians : float, optional Spacing of first uniform point in each resolved topological section (in radians) - see [pygplates.TopologicalSnapshot.calculate_plate_boundary_statistics()](https://www.gplates.org/docs/pygplates/generated/pygplates.topologicalsnapshot#pygplates.TopologicalSnapshot.calculate_plate_boundary_statistics) for more details. Defaults to half of `uniform_point_spacing_radians`. anchor_plate_id : int, optional Anchor plate ID. Defaults to the current anchor plate ID (`anchor_plate_id` attribute). velocity_delta_time : float, default=1.0 The time delta used to calculate velocities (defaults to 1 Myr). velocity_delta_time_type : {pygplates.VelocityDeltaTimeType.t_plus_delta_t_to_t, pygplates.VelocityDeltaTimeType.t_to_t_minus_delta_t, pygplates.VelocityDeltaTimeType.t_plus_minus_half_delta_t}, default=pygplates.VelocityDeltaTimeType.t_plus_delta_t_to_t How the two velocity times are calculated relative to `time` (defaults to ``[time + velocity_delta_time, time]``). velocity_units : {pygplates.VelocityUnits.cms_per_yr, pygplates.VelocityUnits.kms_per_my}, default=pygplates.VelocityUnits.cms_per_yr Whether to return velocities in centimetres per year or kilometres per million years (defaults to centimetres per year). earth_radius_in_kms : float, default=pygplates.Earth.mean_radius_in_kms Radius of the Earth in kilometres. This is only used to calculate velocities (strain rates always use ``pygplates.Earth.equatorial_radius_in_kms``). include_network_boundaries : bool, default=False Whether to sample along network boundaries that are not also plate boundaries (defaults to False). If a deforming network shares a boundary with a plate then it'll get included regardless of this option. include_topological_slab_boundaries : bool, default=False Whether to sample along slab boundaries (features of type `gpml:TopologicalSlabBoundary`). By default they are *not* sampled since they are *not* plate boundaries. boundary_section_filter Same as the ``boundary_section_filter`` argument in [pygplates.TopologicalSnapshot.calculate_plate_boundary_statistics()](https://www.gplates.org/docs/pygplates/generated/pygplates.topologicalsnapshot#pygplates.TopologicalSnapshot.calculate_plate_boundary_statistics). Defaults to ``None`` (meaning all plate boundaries are included by default). Returns ------- diverging_data : list of `pygplates.PlateBoundaryStatistic` The results for all uniformly sampled points along plate boundaries that are *diverging* relative to `divergence_threshold`. The size of the returned list is equal to the number of sampled points that are *diverging*. Each [pygplates.PlateBoundaryStatistic](https://www.gplates.org/docs/pygplates/generated/pygplates.PlateBoundaryStatistic) is guaranteed to have a valid (ie, not ``None``) [convergence velocity](https://www.gplates.org/docs/pygplates/generated/pygplates.PlateBoundaryStatistic.html#pygplates.PlateBoundaryStatistic.convergence_velocity). converging_data : list of `pygplates.PlateBoundaryStatistic` The results for all uniformly sampled points along plate boundaries that are *converging* relative to `convergence_threshold`. The size of the returned list is equal to the number of sampled points that are *converging*. Each [pygplates.PlateBoundaryStatistic](https://www.gplates.org/docs/pygplates/generated/pygplates.PlateBoundaryStatistic) is guaranteed to have a valid (ie, not ``None``) [convergence velocity](https://www.gplates.org/docs/pygplates/generated/pygplates.PlateBoundaryStatistic.html#pygplates.PlateBoundaryStatistic.convergence_velocity). Raises ------ ValueError If topology features have not been set in this `PlateReconstruction`. Examples -------- To sample diverging/converging points along plate boundaries at 50Ma: diverging_data, converging_data = plate_reconstruction.divergent_convergent_plate_boundaries(50) To do the same, but restrict converging data to points where orthogonal converging velocities are greater than 0.2 cm/yr (with diverging data remaining unchanged with the default 0.0 threshold): diverging_data, converging_data = plate_reconstruction.divergent_convergent_plate_boundaries(50, convergence_velocity_threshold=0.2) Notes ----- If you want to access all sampled points regardless of their convergence/divergence you can call `topological_snapshot()` and then use it to directly call [pygplates.TopologicalSnapshot.calculate_plate_boundary_statistics()](https://www.gplates.org/docs/pygplates/generated/pygplates.topologicalsnapshot#pygplates.TopologicalSnapshot.calculate_plate_boundary_statistics). Then you can do your own analysis on the returned data: plate_boundary_statistics = plate_reconstruction.topological_snapshot( time, include_topological_slab_boundaries=False ).calculate_plate_boundary_statistics( uniform_point_spacing_radians=0.001 ) for stat in plate_boundary_statistics: if np.isnan(stat.convergence_velocity_orthogonal) continue # missing left or right plate latitude, longitude = stat.boundary_point.to_lat_lon() """ # Generate statistics at uniformly spaced points along plate boundaries. plate_boundary_statistics = self.topological_snapshot( time, anchor_plate_id=anchor_plate_id, # if None then uses 'self.anchor_plate_id' include_topological_slab_boundaries=include_topological_slab_boundaries, ).calculate_plate_boundary_statistics( uniform_point_spacing_radians, first_uniform_point_spacing_radians=first_uniform_point_spacing_radians, velocity_delta_time=velocity_delta_time, velocity_delta_time_type=velocity_delta_time_type, velocity_units=velocity_units, earth_radius_in_kms=earth_radius_in_kms, include_network_boundaries=include_network_boundaries, boundary_section_filter=boundary_section_filter, ) diverging_point_stats = [] converging_point_stats = [] for stat in plate_boundary_statistics: # Convergence velocity. # # Note: We use the 'orthogonal' component of velocity vector. convergence_velocity_orthogonal = stat.convergence_velocity_orthogonal # Skip current point if missing left or right plate (cannot calculate convergence). if np.isnan(convergence_velocity_orthogonal): continue # Add to diverging points if within the specified divergence velocity threshold. if -convergence_velocity_orthogonal >= divergence_velocity_threshold: diverging_point_stats.append(stat) # Add to converging points if within the specified convergence velocity threshold. if convergence_velocity_orthogonal >= convergence_velocity_threshold: converging_point_stats.append(stat) return diverging_point_stats, converging_point_stats def crustal_production_destruction_rate( self, time, uniform_point_spacing_radians=0.001, divergence_velocity_threshold_in_cms_per_yr=0.0, convergence_velocity_threshold_in_cms_per_yr=0.0, *, first_uniform_point_spacing_radians=None, velocity_delta_time=1.0, velocity_delta_time_type=pygplates.VelocityDeltaTimeType.t_plus_delta_t_to_t, include_network_boundaries=False, include_topological_slab_boundaries=False, boundary_section_filter=None, ): """Calculates the total crustal production and destruction rates (in km^2/yr) of divergent and convergent plate boundaries at the specified geological time (Ma). Resolves topologies at `time` and uniformly samples all plate boundaries into divergent and convergent boundary points. Total crustal production (and destruction) rate is then calculated by accumulating divergent (and convergent) orthogonal velocities multiplied by their local boundary lengths. Velocities and lengths are scaled using the geocentric radius (at each divergent and convergent sampled point). Parameters ---------- time : float The reconstruction time (Ma) at which to query divergent/convergent plate boundaries. uniform_point_spacing_radians : float, default=0.001 The spacing between uniform points along plate boundaries (in radians). divergence_velocity_threshold_in_cms_per_yr : float, default=0.0 Orthogonal (ie, in the direction of boundary normal) velocity threshold for *diverging* sample points. Points with an orthogonal *diverging* velocity above this value will accumulate crustal *production*. The default is `0.0` which removes all converging sample points (leaving only diverging points). This value can be negative which means a small amount of convergence is allowed for the diverging points. The units should be in cm/yr. convergence_velocity_threshold_in_cms_per_yr : float, default=0.0 Orthogonal (ie, in the direction of boundary normal) velocity threshold for *converging* sample points. Points with an orthogonal *converging* velocity above this value will accumulate crustal *destruction*. The default is `0.0` which removes all diverging sample points (leaving only converging points). This value can be negative which means a small amount of divergence is allowed for the converging points. The units should be in cm/yr. first_uniform_point_spacing_radians : float, optional Spacing of first uniform point in each resolved topological section (in radians) - see `divergent_convergent_plate_boundaries()` for more details. Defaults to half of `uniform_point_spacing_radians`. velocity_delta_time : float, default=1.0 The time delta used to calculate velocities (defaults to 1 Myr). velocity_delta_time_type : {pygplates.VelocityDeltaTimeType.t_plus_delta_t_to_t, pygplates.VelocityDeltaTimeType.t_to_t_minus_delta_t, pygplates.VelocityDeltaTimeType.t_plus_minus_half_delta_t}, default=pygplates.VelocityDeltaTimeType.t_plus_delta_t_to_t How the two velocity times are calculated relative to `time` (defaults to ``[time + velocity_delta_time, time]``). include_network_boundaries : bool, default=False Whether to sample along network boundaries that are not also plate boundaries (defaults to False). If a deforming network shares a boundary with a plate then it'll get included regardless of this option. include_topological_slab_boundaries : bool, default=False Whether to sample along slab boundaries (features of type `gpml:TopologicalSlabBoundary`). By default they are *not* sampled since they are *not* plate boundaries. boundary_section_filter Same as the ``boundary_section_filter`` argument in `divergent_convergent_plate_boundaries()`. Defaults to ``None`` (meaning all plate boundaries are included by default). Returns ------- total_crustal_production_rate_in_km_2_per_yr : float The total rate of crustal *production* at divergent plate boundaries (in km^2/yr) at the specified `time`. total_crustal_destruction_rate_in_km_2_per_yr : float The total rate of crustal *destruction* at convergent plate boundaries (in km^2/yr) at the specified `time`. Raises ------ ValueError If topology features have not been set in this `PlateReconstruction`. Examples -------- To calculate total crustal production/destruction along plate boundaries at 50Ma: total_crustal_production_rate_in_km_2_per_yr, total_crustal_destruction_rate_in_km_2_per_yr = plate_reconstruction.crustal_production_destruction_rate(50) To do the same, but restrict convergence to points where orthogonal converging velocities are greater than 0.2 cm/yr (with divergence remaining unchanged with the default 0.0 threshold): total_crustal_production_rate_in_km_2_per_yr, total_crustal_destruction_rate_in_km_2_per_yr = plate_reconstruction.crustal_production_destruction_rate(50, convergence_velocity_threshold_in_cms_per_yr=0.2) """ # Generate statistics at uniformly spaced points along plate boundaries. diverging_data, converging_data = self.divergent_convergent_plate_boundaries( time, uniform_point_spacing_radians=uniform_point_spacing_radians, divergence_velocity_threshold=divergence_velocity_threshold_in_cms_per_yr, convergence_velocity_threshold=convergence_velocity_threshold_in_cms_per_yr, first_uniform_point_spacing_radians=first_uniform_point_spacing_radians, velocity_delta_time=velocity_delta_time, velocity_delta_time_type=velocity_delta_time_type, velocity_units=pygplates.VelocityUnits.cms_per_yr, earth_radius_in_kms=pygplates.Earth.mean_radius_in_kms, include_network_boundaries=include_network_boundaries, include_topological_slab_boundaries=include_topological_slab_boundaries, boundary_section_filter=boundary_section_filter, ) # Total crustal production rate at divergent plate boundaries. total_crustal_production_rate = 0.0 for stat in diverging_data: # Get actual Earth radius at current latitude. boundary_lat, _ = stat.boundary_point.to_lat_lon() earth_radius_kms = _tools.geocentric_radius(boundary_lat) / 1e3 # Convergence velocity was calculated using pygplates.Earth.mean_radius_in_kms, # so adjust for actual Earth radius 'earth_radius_kms' at current latitude. convergence_velocity_orthogonal = stat.convergence_velocity_orthogonal * ( earth_radius_kms / pygplates.Earth.mean_radius_in_kms ) # Calculate crustal production rate at current location (in km^2/yr). # # Note: Orthogonal convergence velocity is guaranteed to be non-NaN. crustal_production_rate = ( -convergence_velocity_orthogonal # negate for divergence * 1e-5 # convert cm/yr to km/yr * stat.boundary_length # radians * earth_radius_kms # km ) total_crustal_production_rate += crustal_production_rate # Total crustal destruction rate at convergent plate boundaries. total_crustal_destruction_rate = 0.0 for stat in converging_data: # Get actual Earth radius at current latitude. boundary_lat, _ = stat.boundary_point.to_lat_lon() earth_radius_kms = _tools.geocentric_radius(boundary_lat) / 1e3 # Convergence velocity was calculated using pygplates.Earth.mean_radius_in_kms, # so adjust for actual Earth radius 'earth_radius_kms' at current latitude. convergence_velocity_orthogonal = stat.convergence_velocity_orthogonal * ( earth_radius_kms / pygplates.Earth.mean_radius_in_kms ) # Calculate crustal destruction rate at current location (in km^2/yr). # # Note: Orthogonal convergence velocity is guaranteed to be non-NaN. crustal_destruction_rate = ( convergence_velocity_orthogonal * 1e-5 # convert cm/yr to km/yr * stat.boundary_length # radians * earth_radius_kms # km ) total_crustal_destruction_rate += crustal_destruction_rate return total_crustal_production_rate, total_crustal_destruction_rate def _subduction_convergence( self, time, uniform_point_spacing_radians, velocity_delta_time, anchor_plate_id, include_network_boundaries, convergence_threshold_in_cm_per_yr, output_distance_to_nearest_edge_of_trench=False, output_distance_to_start_edge_of_trench=False, output_convergence_velocity_components=False, output_trench_absolute_velocity_components=False, output_subducting_absolute_velocity=False, output_subducting_absolute_velocity_components=False, output_trench_normal=False, ): # # This is essentially a replacement for 'ptt.subduction_convergence.subduction_convergence()'. # # Instead of calculating convergence along subduction zones using subducting and overriding plate IDs, # it uses pyGPlates 1.0 functionality that calculates statistics along plate boundaries # (such as plate velocities, from which convergence velocity can be obtained). # # Note that this function has an advantage over 'ptt.subduction_convergence.subduction_convergence()': # It does not reject subducting boundaries that have more than one (or even zero) subducting plates (or subducting networks), # which can happen if the topological model was built incorrectly (eg, mislabelled plate boundaries). # As long as there's at least one plate (or network) on the subducting side then it can find it # (even if the plate is not directly attached to the subduction zone, ie, doesn't specify it as part of its boundary). # However, like 'ptt.subduction_convergence.subduction_convergence()', it only samples plate boundaries that have a # subduction polarity (eg, subduction zones) since we still need to know which plates are subducting and overriding, # and hence cannot calculate convergence over all plate boundaries. # Restrict plate boundaries to those that have a subduction polarity. # This is just an optimisation to avoid unnecessarily sampling all plate boundaries. def _boundary_section_filter_function(resolved_topological_section): return ( resolved_topological_section.get_feature().get_enumeration( pygplates.PropertyName.gpml_subduction_polarity ) is not None ) # Generate statistics at uniformly spaced points along plate boundaries. plate_boundary_statistics_dict = self.topological_snapshot( time, anchor_plate_id=anchor_plate_id, # if None then uses 'self.anchor_plate_id' (default anchor plate of 'self.rotation_model') # Ignore topological slab boundaries since they are not *plate* boundaries # (a slab edge could have a subduction polarity, and would otherwise get included)... include_topological_slab_boundaries=False, ).calculate_plate_boundary_statistics( uniform_point_spacing_radians, first_uniform_point_spacing_radians=0, velocity_delta_time=velocity_delta_time, velocity_units=pygplates.VelocityUnits.cms_per_yr, include_network_boundaries=include_network_boundaries, boundary_section_filter=_boundary_section_filter_function, return_shared_sub_segment_dict=True, ) subduction_data = [] # Iterate over the shared boundary sub-segments (each one will have a list of uniform points). for ( shared_sub_segment, shared_sub_segment_stats, ) in plate_boundary_statistics_dict.items(): # Find the subduction plate of the current shared boundary sub-segment. subducting_plate_and_polarity = shared_sub_segment.get_subducting_plate( return_subduction_polarity=True, enforce_single_plate=False, ) # Skip current shared boundary sub-segment if it doesn't have a valid subduction polarity. # # Note: There might not even be a subducting plate directly attached, but that's fine because # we're only interested in the subduction polarity. Later we'll get the subducting plate # from the plate boundary statistics instead (since that's more reliable). if not subducting_plate_and_polarity: continue _, subduction_polarity = subducting_plate_and_polarity if subduction_polarity == "Left": overriding_plate_is_on_left = True else: overriding_plate_is_on_left = False # Iterate over the uniform points of the current shared boundary sub-segment. for stat in shared_sub_segment_stats: # Find subducting plate velocity (opposite to overriding plate). if overriding_plate_is_on_left: subducting_plate_velocity = stat.right_plate_velocity else: subducting_plate_velocity = stat.left_plate_velocity # Reject point if there's no subducting plate (or network). if subducting_plate_velocity is None: continue # The convergence velocity is actually that of the subducting plate relative to the trench line. # It's not the right plate relative to the left (or vice versa). convergence_velocity = ( subducting_plate_velocity - stat.boundary_velocity ) # Get the trench normal (and azimuth). trench_normal = stat.boundary_normal trench_normal_azimuth = stat.boundary_normal_azimuth # If the trench normal (in direction of overriding plate) is opposite the boundary line normal # (which is to the left) then flip it. if not overriding_plate_is_on_left: trench_normal = -trench_normal trench_normal_azimuth -= np.pi # Keep in the range [0, 2*pi]. if trench_normal_azimuth < 0: trench_normal_azimuth += 2 * np.pi # If requested, reject point if it's not converging within specified threshold. if convergence_threshold_in_cm_per_yr is not None: # Note that we use the 'orthogonal' component of velocity vector. if ( pygplates.Vector3D.dot(convergence_velocity, trench_normal) < convergence_threshold_in_cm_per_yr ): continue # Convergence velocity magnitude and obliquity. if convergence_velocity.is_zero_magnitude(): convergence_velocity_magnitude = 0 convergence_obliquity = 0 else: convergence_velocity_magnitude = ( convergence_velocity.get_magnitude() ) convergence_obliquity = pygplates.Vector3D.angle_between( convergence_velocity, trench_normal ) # The direction towards which we rotate from the trench normal in a clockwise fashion. clockwise_direction = pygplates.Vector3D.cross( trench_normal, stat.boundary_point.to_xyz() ) # Anti-clockwise direction has range (0, -pi) instead of (0, pi). if ( pygplates.Vector3D.dot( convergence_velocity, clockwise_direction ) < 0 ): convergence_obliquity = -convergence_obliquity # See if plates are diverging (moving away from each other). # If plates are diverging (moving away from each other) then make the # velocity magnitude negative to indicate this. This could be inferred from # the obliquity but it seems this is the standard way to output convergence rate. # # Note: This is the same as done in 'ptt.subduction_convergence.subduction_convergence()'. if pygplates.Vector3D.dot(convergence_velocity, trench_normal) < 0: convergence_velocity_magnitude = -convergence_velocity_magnitude # Trench absolute velocity magnitude and obliquity. trench_absolute_velocity_magnitude = stat.boundary_velocity_magnitude trench_absolute_velocity_obliquity = stat.boundary_velocity_obliquity # If the trench normal (in direction of overriding plate) is opposite the boundary line normal (which is to the left) # then we need to flip the obliquity of the trench absolute velocity vector. This is because it's currently relative # to the boundary line normal but needs to be relative to the trench normal. if not overriding_plate_is_on_left: trench_absolute_velocity_obliquity -= np.pi # Keep obliquity in the range [-pi, pi]. if trench_absolute_velocity_obliquity < -np.pi: trench_absolute_velocity_obliquity += 2 * np.pi # See if the trench absolute motion is heading in the direction of the # overriding plate. If it is then make the velocity magnitude negative to # indicate this. This could be inferred from the obliquity but it seems this # is the standard way to output trench velocity magnitude. # # Note that we are not calculating the motion of the trench # relative to the overriding plate - they are usually attached to each other # and hence wouldn't move relative to each other. # # Note: This is the same as done in 'ptt.subduction_convergence.subduction_convergence()'. if np.abs(trench_absolute_velocity_obliquity) < 0.5 * np.pi: trench_absolute_velocity_magnitude = ( -trench_absolute_velocity_magnitude ) lat, lon = stat.boundary_point.to_lat_lon() # The plate ID along the trench line. # # Note: The plate IDs along the trench line and overriding plate ID can differ even in a non-deforming model # due to smaller plates, not modelled by topologies, moving differently than the larger topological # plate being modelled - and the trench line having plate IDs of the smaller plates near them. # For that reason we use the plate IDs of the trench line (rather than the overriding plate ID). # # Note: Using 'pygplates.PlateBoundaryStatistic.boundary_feature' means that if the current shared sub-segment # is part of a topological line then this will obtain a plate ID from whichever sub-segment, of the current # shared sub-segment, the current boundary point lies on (rather than obtaining a plate ID from the # shared sub-segment itself). This is because a trench line that is a topological line might actually be # deforming (or intended to be deforming) and hence its plate ID is not meaningful, or at least we can't # be sure whether it will be zero or the overriding plate (or something else). # trench_plate_id = stat.boundary_feature.get_reconstruction_plate_id() if overriding_plate_is_on_left: subducting_plate = stat.right_plate else: subducting_plate = stat.left_plate # Get the subducting plate ID from resolved topological boundary (or network). if subducting_plate.located_in_resolved_boundary(): subducting_plate_id = ( subducting_plate.located_in_resolved_boundary() .get_feature() .get_reconstruction_plate_id() ) else: subducting_plate_id = ( subducting_plate.located_in_resolved_network() .get_feature() .get_reconstruction_plate_id() ) output_tuple = ( lon, lat, convergence_velocity_magnitude, np.degrees(convergence_obliquity), trench_absolute_velocity_magnitude, np.degrees(trench_absolute_velocity_obliquity), np.degrees(stat.boundary_length), np.degrees(trench_normal_azimuth), subducting_plate_id, trench_plate_id, ) if output_distance_to_nearest_edge_of_trench: distance_to_nearest_edge_of_trench = min( stat.distance_from_start_of_topological_section, stat.distance_to_end_of_topological_section, ) output_tuple += (np.degrees(distance_to_nearest_edge_of_trench),) if output_distance_to_start_edge_of_trench: # We want the distance to be along the clockwise direction around the overriding plate. if overriding_plate_is_on_left: # The overriding plate is on the left of the trench. # So the clockwise direction starts at the end of the trench. distance_to_start_edge_of_trench = ( stat.distance_to_end_of_topological_section ) else: # The overriding plate is on the right of the trench. # So the clockwise direction starts at the beginning of the trench. distance_to_start_edge_of_trench = ( stat.distance_from_start_of_topological_section ) output_tuple += (np.degrees(distance_to_start_edge_of_trench),) if output_convergence_velocity_components: # The orthogonal and parallel components are just magnitude multiplied by cosine and sine. convergence_velocity_orthogonal = np.cos( convergence_obliquity ) * np.abs(convergence_velocity_magnitude) convergence_velocity_parallel = np.sin( convergence_obliquity ) * np.abs(convergence_velocity_magnitude) output_tuple += ( convergence_velocity_orthogonal, convergence_velocity_parallel, ) if output_trench_absolute_velocity_components: # The orthogonal and parallel components are just magnitude multiplied by cosine and sine. trench_absolute_velocity_orthogonal = np.cos( trench_absolute_velocity_obliquity ) * np.abs(trench_absolute_velocity_magnitude) trench_absolute_velocity_parallel = np.sin( trench_absolute_velocity_obliquity ) * np.abs(trench_absolute_velocity_magnitude) output_tuple += ( trench_absolute_velocity_orthogonal, trench_absolute_velocity_parallel, ) if ( output_subducting_absolute_velocity or output_subducting_absolute_velocity_components ): # Subducting absolute velocity magnitude and obliquity. # # Note: Subducting plate is opposite the overriding plate. if overriding_plate_is_on_left: subducting_absolute_velocity_magnitude = ( stat.right_plate_velocity_magnitude ) subducting_absolute_velocity_obliquity = ( stat.right_plate_velocity_obliquity ) else: subducting_absolute_velocity_magnitude = ( stat.left_plate_velocity_magnitude ) subducting_absolute_velocity_obliquity = ( stat.left_plate_velocity_obliquity ) # Flip obliquity since trench normal (towards overidding plate on right) # is opposite the boundary line normal (towards left). subducting_absolute_velocity_obliquity -= np.pi # Keep obliquity in the range [-pi, pi]. if subducting_absolute_velocity_obliquity < -np.pi: subducting_absolute_velocity_obliquity += 2 * np.pi # Similar to the trench absolute motion, if subducting absolute motion is heading # in the direction of the overriding plate then make the velocity magnitude negative. if np.abs(subducting_absolute_velocity_obliquity) < 0.5 * np.pi: subducting_absolute_velocity_magnitude = ( -subducting_absolute_velocity_magnitude ) if output_subducting_absolute_velocity: output_tuple += ( subducting_absolute_velocity_magnitude, np.degrees(subducting_absolute_velocity_obliquity), ) if output_subducting_absolute_velocity_components: # The orthogonal and parallel components are just magnitude multiplied by cosine and sine. subducting_absolute_velocity_orthogonal = np.cos( subducting_absolute_velocity_obliquity ) * np.abs(subducting_absolute_velocity_magnitude) subducting_absolute_velocity_parallel = np.sin( subducting_absolute_velocity_obliquity ) * np.abs(subducting_absolute_velocity_magnitude) output_tuple += ( subducting_absolute_velocity_orthogonal, subducting_absolute_velocity_parallel, ) if output_trench_normal: output_tuple += trench_normal.to_xyz() subduction_data.append(output_tuple) return subduction_data def tessellate_subduction_zones( self, time, tessellation_threshold_radians=0.001, ignore_warnings=False, return_geodataframe=False, *, use_ptt=False, include_network_boundaries=False, convergence_threshold_in_cm_per_yr=None, anchor_plate_id=None, velocity_delta_time=1.0, output_distance_to_nearest_edge_of_trench=False, output_distance_to_start_edge_of_trench=False, output_convergence_velocity_components=False, output_trench_absolute_velocity_components=False, output_subducting_absolute_velocity=False, output_subducting_absolute_velocity_components=False, output_trench_normal=False, ): """Samples points along subduction zone trenches and obtains subduction data at a particular geological time. Resolves topologies at `time` and tessellates all resolved subducting features into points. Returns a 10-column vertically-stacked tuple with the following data per sampled trench point: * Col. 0 - longitude of sampled trench point * Col. 1 - latitude of sampled trench point * Col. 2 - subducting convergence (relative to trench) velocity magnitude (in cm/yr) * Col. 3 - subducting convergence velocity obliquity angle in degrees (angle between trench normal vector and convergence velocity vector) * Col. 4 - trench absolute (relative to anchor plate) velocity magnitude (in cm/yr) * Col. 5 - trench absolute velocity obliquity angle in degrees (angle between trench normal vector and trench absolute velocity vector) * Col. 6 - length of arc segment (in degrees) that current point is on * Col. 7 - trench normal (in subduction direction, ie, towards overriding plate) azimuth angle (clockwise starting at North, ie, 0 to 360 degrees) at current point * Col. 8 - subducting plate ID * Col. 9 - trench plate ID The optional 'output_*' parameters can be used to append extra data to the output tuple of each sampled trench point. The order of any extra data is the same order in which the parameters are listed below. Parameters ---------- time : float The reconstruction time (Ma) at which to query subduction convergence. tessellation_threshold_radians : float, default=0.001 The threshold sampling distance along the plate boundaries (in radians). ignore_warnings : bool, default=False Choose to ignore warnings from Plate Tectonic Tools' subduction_convergence workflow (if `use_ptt` is `True`). return_geodataframe : bool, default=False Choose to return data in a geopandas.GeoDataFrame. use_ptt : bool, default=False If set to `True` then uses Plate Tectonic Tools' `subduction_convergence` workflow to calculate subduction convergence (which uses the subducting stage rotation of the subduction/trench plate IDs calculate subducting velocities). If set to `False` then uses plate convergence to calculate subduction convergence (which samples velocities of the two adjacent boundary plates at each sampled point to calculate subducting velocities). Both methods ignore plate boundaries that do not have a subduction polarity (feature property), which essentially means they only sample subduction zones. include_network_boundaries : bool, default=False Whether to calculate subduction convergence along network boundaries that are not also plate boundaries (defaults to False). If a deforming network shares a boundary with a plate then it'll get included regardless of this option. Since subduction zones occur along *plate* boundaries this would only be an issue if an intra-plate network boundary was incorrectly labelled as subducting. convergence_threshold_in_cm_per_yr : float, optional Only return sample points with an orthogonal (ie, in the subducting geometry's normal direction) converging velocity above this value (in cm/yr). For example, setting this to `0.0` would remove all diverging sample points (leaving only converging points). This value can be negative which means a small amount of divergence is allowed. If `None` then all (converging and diverging) sample points are returned. This is the default. Note that this parameter can only be specified if `use_ptt` is `False`. anchor_plate_id : int, optional Anchor plate ID. Defaults to the current anchor plate ID (`anchor_plate_id` attribute).. velocity_delta_time : float, default=1.0 Velocity delta time used in convergence velocity calculations (defaults to 1 Myr). output_distance_to_nearest_edge_of_trench : bool, default=False Append the distance (in degrees) along the trench line to the nearest trench edge to each returned sample point. A trench edge is the farthermost location on the current trench feature that contributes to a plate boundary. output_distance_to_start_edge_of_trench : bool, default=False Append the distance (in degrees) along the trench line from the start edge of the trench to each returned sample point. The start of the trench is along the clockwise direction around the overriding plate. output_convergence_velocity_components : bool, default=False Append the convergence velocity orthogonal and parallel components (in cm/yr) to each returned sample point. Orthogonal is normal to trench (in direction of overriding plate when positive). Parallel is along trench (90 degrees clockwise from trench normal when positive). output_trench_absolute_velocity_components : bool, default=False Append the trench absolute velocity orthogonal and parallel components (in cm/yr) to each returned sample point. Orthogonal is normal to trench (in direction of overriding plate when positive). Parallel is along trench (90 degrees clockwise from trench normal when positive). output_subducting_absolute_velocity : bool, default=False Append the subducting plate absolute velocity magnitude (in cm/yr) and obliquity angle (in degrees) to each returned sample point. output_subducting_absolute_velocity_components : bool, default=False Append the subducting plate absolute velocity orthogonal and parallel components (in cm/yr) to each returned sample point. Orthogonal is normal to trench (in direction of overriding plate when positive). Parallel is along trench (90 degrees clockwise from trench normal when positive). output_trench_normal : bool, default=False Append the x, y and z components of the trench normal unit-length 3D vectors. These vectors are normal to the trench in the direction of subduction (towards overriding plate). These are global 3D vectors which differ from trench normal azimuth angles (ie, angles relative to North). Returns ------- subduction_data : a list of vertically-stacked tuples The results for all tessellated points sampled along the trench. The size of the returned list is equal to the number of tessellated points. Each tuple in the list corresponds to a tessellated point and has the following tuple items: * Col. 0 - longitude of sampled trench point * Col. 1 - latitude of sampled trench point * Col. 2 - subducting convergence (relative to trench) velocity magnitude (in cm/yr) * Col. 3 - subducting convergence velocity obliquity angle in degrees (angle between trench normal vector and convergence velocity vector) * Col. 4 - trench absolute (relative to anchor plate) velocity magnitude (in cm/yr) * Col. 5 - trench absolute velocity obliquity angle in degrees (angle between trench normal vector and trench absolute velocity vector) * Col. 6 - length of arc segment (in degrees) that current point is on * Col. 7 - trench normal (in subduction direction, ie, towards overriding plate) azimuth angle (clockwise starting at North, ie, 0 to 360 degrees) at current point * Col. 8 - subducting plate ID * Col. 9 - trench plate ID The optional 'output_*' parameters can be used to append extra data to the tuple of each sampled trench point. The order of any extra data is the same order in which the parameters are listed in this function. Raises ------ ValueError If topology features have not been set in this `PlateReconstruction`. ValueError If `use_ptt` is `True` and `convergence_threshold_in_cm_per_yr` is not `None`. Notes ----- If `use_ptt` is False then each trench is sampled at *exactly* uniform intervals along its length such that the sampled points have a uniform spacing (along each trench polyline) that is *equal* to `tessellation_threshold_radians`. If `use_ptt` is True then each trench is sampled at *approximately* uniform intervals along its length such that the sampled points have a uniform spacing (along each trench polyline) that is *less than or equal to* `tessellation_threshold_radians`. The trench normal (at each sampled trench point) always points *towards* the overriding plate. The obliquity angles are in the range (-180, 180). The range (0, 180) goes clockwise (when viewed from above the Earth) from the trench normal direction to the velocity vector. The range (0, -180) goes counter-clockwise. You can change the range (-180, 180) to the range (0, 360) by adding 360 to negative angles. The trench normal is perpendicular to the trench and pointing toward the overriding plate. Note that the convergence velocity magnitude is negative if the plates are diverging (if convergence obliquity angle is greater than 90 or less than -90). And note that the trench absolute velocity magnitude is negative if the trench (subduction zone) is moving towards the overriding plate (if trench absolute obliquity angle is less than 90 and greater than -90) - note that this ignores the kinematics of the subducting plate. Similiarly for the subducting plate absolute velocity magnitude (if keyword argument `output_subducting_absolute_velocity` is True). The trench plate ID at each sample point can differ from the overriding plate ID. This is because, even in a non-deforming model, the smaller plates (not modelled by topologies) can move differently than the larger topological plate. So the trench line has the plate IDs of the smaller plates. Examples -------- To sample points along subduction zones at 50Ma: subduction_data = plate_reconstruction.tessellate_subduction_zones(50) To sample points along subduction zones at 50Ma, but only where there's convergence: subduction_data = plate_reconstruction.tessellate_subduction_zones(50, convergence_threshold_in_cm_per_yr=0.0) """ if use_ptt: from . import ptt as _ptt if convergence_threshold_in_cm_per_yr is not None: raise ValueError( "Can only specify 'convergence_threshold_in_cm_per_yr' if 'use_ptt' is False." ) with warnings.catch_warnings(): if ignore_warnings: warnings.simplefilter("ignore") subduction_data = _ptt.subduction_convergence.subduction_convergence( self.rotation_model, self._check_topology_features( # Ignore topological slab boundaries since they are not *plate* boundaries # (actually they get ignored by default in 'ptt.subduction_convergence' anyway)... include_topological_slab_boundaries=False ), tessellation_threshold_radians, time, velocity_delta_time=velocity_delta_time, anchor_plate_id=anchor_plate_id, # if None then uses 'self.anchor_plate_id' (default anchor plate of 'self.rotation_model') include_network_boundaries=include_network_boundaries, output_distance_to_nearest_edge_of_trench=output_distance_to_nearest_edge_of_trench, output_distance_to_start_edge_of_trench=output_distance_to_start_edge_of_trench, output_convergence_velocity_components=output_convergence_velocity_components, output_trench_absolute_velocity_components=output_trench_absolute_velocity_components, output_subducting_absolute_velocity=output_subducting_absolute_velocity, output_subducting_absolute_velocity_components=output_subducting_absolute_velocity_components, output_trench_normal=output_trench_normal, ) else: subduction_data = self._subduction_convergence( time, uniform_point_spacing_radians=tessellation_threshold_radians, velocity_delta_time=velocity_delta_time, anchor_plate_id=anchor_plate_id, # if None then uses 'self.anchor_plate_id' (default anchor plate of 'self.rotation_model') include_network_boundaries=include_network_boundaries, convergence_threshold_in_cm_per_yr=convergence_threshold_in_cm_per_yr, output_distance_to_nearest_edge_of_trench=output_distance_to_nearest_edge_of_trench, output_distance_to_start_edge_of_trench=output_distance_to_start_edge_of_trench, output_convergence_velocity_components=output_convergence_velocity_components, output_trench_absolute_velocity_components=output_trench_absolute_velocity_components, output_subducting_absolute_velocity=output_subducting_absolute_velocity, output_subducting_absolute_velocity_components=output_subducting_absolute_velocity_components, output_trench_normal=output_trench_normal, ) if subduction_data: subduction_data = np.vstack(subduction_data) else: # No subduction data. num_columns = 10 if output_distance_to_nearest_edge_of_trench: num_columns += 1 if output_distance_to_start_edge_of_trench: num_columns += 1 if output_convergence_velocity_components: num_columns += 2 if output_trench_absolute_velocity_components: num_columns += 2 if output_subducting_absolute_velocity: num_columns += 2 if output_subducting_absolute_velocity_components: num_columns += 2 if output_trench_normal: num_columns += 3 subduction_data = np.empty((0, num_columns)) if return_geodataframe: import geopandas as gpd from shapely import geometry points = [ geometry.Point(lon, lat) for lon, lat in zip(subduction_data[:, 0], subduction_data[:, 1]) ] # Required data. gdf_data = { "geometry": points, "convergence velocity (cm/yr)": subduction_data[:, 2], "convergence obliquity angle (degrees)": subduction_data[:, 3], "trench velocity (cm/yr)": subduction_data[:, 4], "trench obliquity angle (degrees)": subduction_data[:, 5], "length (degrees)": subduction_data[:, 6], "trench normal angle (degrees)": subduction_data[:, 7], "subducting plate ID": subduction_data[:, 8], "trench plate ID": subduction_data[:, 9], } # Optional data. # # Note: The order must match the output order. optional_gdf_data_index = 10 if output_distance_to_nearest_edge_of_trench: gdf_data["distance to nearest trench edge (degrees)"] = subduction_data[ :, optional_gdf_data_index ] optional_gdf_data_index += 1 if output_distance_to_start_edge_of_trench: gdf_data["distance to start of trench edge (degrees)"] = ( subduction_data[:, optional_gdf_data_index] ) optional_gdf_data_index += 1 if output_convergence_velocity_components: gdf_data["convergence velocity orthogonal component (cm/yr)"] = ( subduction_data[:, optional_gdf_data_index] ) gdf_data["convergence velocity parallel component (cm/yr)"] = ( subduction_data[:, optional_gdf_data_index + 1] ) optional_gdf_data_index += 2 if output_trench_absolute_velocity_components: gdf_data["trench absolute velocity orthogonal component (cm/yr)"] = ( subduction_data[:, optional_gdf_data_index] ) gdf_data["trench absolute velocity parallel component (cm/yr)"] = ( subduction_data[:, optional_gdf_data_index + 1] ) optional_gdf_data_index += 2 if output_subducting_absolute_velocity: gdf_data["subducting absolute velocity (cm/yr)"] = subduction_data[ :, optional_gdf_data_index ] gdf_data["subducting absolute obliquity angle (degrees)"] = ( subduction_data[:, optional_gdf_data_index + 1] ) optional_gdf_data_index += 2 if output_subducting_absolute_velocity_components: gdf_data[ "subducting absolute velocity orthogonal component (cm/yr)" ] = subduction_data[:, optional_gdf_data_index] gdf_data["subducting absolute velocity parallel component (cm/yr)"] = ( subduction_data[:, optional_gdf_data_index + 1] ) optional_gdf_data_index += 2 if output_trench_normal: gdf_data["trench normal (unit-length 3D vector) x component"] = ( subduction_data[:, optional_gdf_data_index] ) gdf_data["trench normal (unit-length 3D vector) y component"] = ( subduction_data[:, optional_gdf_data_index + 1] ) gdf_data["trench normal (unit-length 3D vector) z component"] = ( subduction_data[:, optional_gdf_data_index + 2] ) optional_gdf_data_index += 3 gdf = gpd.GeoDataFrame(gdf_data, geometry="geometry") return gdf else: return subduction_data def total_subduction_zone_length( self, time, use_ptt=False, ignore_warnings=False, *, include_network_boundaries=False, convergence_threshold_in_cm_per_yr=None, ): """Calculates the total length of all subduction zones (km) at the specified geological time (Ma). Resolves topologies at `time` and tessellates all resolved subducting features into points (see `tessellate_subduction_zones`). Total length is calculated by sampling points along the resolved subducting features (e.g. subduction zones) and accumulating their lengths (see `tessellate_subduction_zones`). Scales lengths to kilometres using the geocentric radius (at each sampled point). Parameters ---------- time : int The geological time at which to calculate total subduction zone lengths. use_ptt : bool, default=False If set to `True` then uses Plate Tectonic Tools' `subduction_convergence` workflow to calculate total subduction zone length. If set to `False` then uses plate convergence instead. Plate convergence is the more general approach that works along all plate boundaries (not just subduction zones). ignore_warnings : bool, default=False Choose to ignore warnings from Plate Tectonic Tools' subduction_convergence workflow (if `use_ptt` is `True`). include_network_boundaries : bool, default=False Whether to count lengths along network boundaries that are not also plate boundaries (defaults to False). If a deforming network shares a boundary with a plate then it'll get included regardless of this option. Since subduction zones occur along *plate* boundaries this would only be an issue if an intra-plate network boundary was incorrectly labelled as subducting. convergence_threshold_in_cm_per_yr : float, optional Only count lengths associated with sample points that have an orthogonal (ie, in the subducting geometry's normal direction) converging velocity above this value (in cm/yr). For example, setting this to `0.0` would remove all diverging sample points (leaving only converging points). This value can be negative which means a small amount of divergence is allowed. If `None` then all (converging and diverging) sample points are counted. This is the default. Note that this parameter can only be specified if `use_ptt` is `False`. Returns ------- total_subduction_zone_length_kms : float The total subduction zone length (in km) at the specified `time`. Raises ------ ValueError If topology features have not been set in this `PlateReconstruction`. ValueError If `use_ptt` is `True` and `convergence_threshold_in_cm_per_yr` is not `None`. Examples -------- To calculate the total length of subduction zones at 50Ma: total_subduction_zone_length_kms = plate_reconstruction.total_subduction_zone_length(50) To calculate the total length of subduction zones at 50Ma, but only where there's actual convergence: total_subduction_zone_length_kms = plate_reconstruction.total_subduction_zone_length(50, convergence_threshold_in_cm_per_yr=0.0) """ subduction_data = self.tessellate_subduction_zones( time, ignore_warnings=ignore_warnings, use_ptt=use_ptt, include_network_boundaries=include_network_boundaries, convergence_threshold_in_cm_per_yr=convergence_threshold_in_cm_per_yr, ) trench_arcseg = subduction_data[:, 6] trench_pt_lat = subduction_data[:, 1] total_subduction_zone_length_kms = 0 for i, segment in enumerate(trench_arcseg): earth_radius = _tools.geocentric_radius(trench_pt_lat[i]) / 1e3 total_subduction_zone_length_kms += np.deg2rad(segment) * earth_radius return total_subduction_zone_length_kms def total_continental_arc_length( self, time, continental_grid, trench_arc_distance, ignore_warnings=True, *, use_ptt=False, include_network_boundaries=False, convergence_threshold_in_cm_per_yr=None, ): """Calculates the total length of all global continental arcs (km) at the specified geological time (Ma). Resolves topologies at `time` and tessellates all resolved subducting features into points (see `tessellate_subduction_zones`). The resolved points then are projected out by the `trench_arc_distance` (towards overriding plate) and their new locations are linearly interpolated onto the supplied `continental_grid`. If the projected trench points lie in the grid, they are considered continental arc points, and their arc segment lengths are appended to the total continental arc length for the specified `time`. The total length is scaled to kilometres using the geocentric radius (at each sampled point). Parameters ---------- time : int The geological time at which to calculate total continental arc lengths. continental_grid: Raster, array_like, or str The continental grid used to identify continental arc points. Must be convertible to `Raster`. For an array, a global extent is assumed [-180,180,-90,90]. For a filename, the extent is obtained from the file. trench_arc_distance : float The trench-to-arc distance (in kilometres) to project sampled trench points out by in the direction of the overriding plate. ignore_warnings : bool, default=True Choose whether to ignore warning messages from Plate Tectonic Tools' subduction_convergence workflow (if `use_ptt` is `True`) that alerts the user of subduction sub-segments that are ignored due to unidentified polarities and/or subducting plates. use_ptt : bool, default=False If set to `True` then uses Plate Tectonic Tools' `subduction_convergence` workflow to sample subducting features and their subduction polarities. If set to `False` then uses plate convergence instead. Plate convergence is the more general approach that works along all plate boundaries (not just subduction zones). include_network_boundaries : bool, default=False Whether to sample subducting features along network boundaries that are not also plate boundaries (defaults to False). If a deforming network shares a boundary with a plate then it'll get included regardless of this option. Since subduction zones occur along *plate* boundaries this would only be an issue if an intra-plate network boundary was incorrectly labelled as subducting. convergence_threshold_in_cm_per_yr : float, optional Only sample points with an orthogonal (ie, in the subducting geometry's normal direction) converging velocity above this value (in cm/yr). For example, setting this to `0.0` would remove all diverging sample points (leaving only converging points). This value can be negative which means a small amount of divergence is allowed. If `None` then all (converging and diverging) points are sampled. This is the default. Note that this parameter can only be specified if `use_ptt` is `False`. Returns ------- total_continental_arc_length_kms : float The continental arc length (in km) at the specified time. Raises ------ ValueError If topology features have not been set in this `PlateReconstruction`. ValueError If `use_ptt` is `True` and `convergence_threshold_in_cm_per_yr` is not `None`. Examples -------- To calculate the total length of continental arcs at 50Ma: total_continental_arc_length_kms = plate_reconstruction.total_continental_arc_length(50) To calculate the total length of subduction zones adjacent to continents at 50Ma, but only where there's actual convergence: total_continental_arc_length_kms = plate_reconstruction.total_continental_arc_length(50, convergence_threshold_in_cm_per_yr=0.0) """ from . import grids as _grids if isinstance(continental_grid, _grids.Raster): graster = continental_grid elif isinstance(continental_grid, str): # Process the continental grid directory graster = _grids.Raster( data=continental_grid, realign=True, time=float(time), ) else: # Process the masked continental grid try: continental_grid = np.array(continental_grid) graster = _grids.Raster( data=continental_grid, extent=[-180, 180, -90, 90], time=float(time), ) except Exception as e: raise TypeError( "Invalid type for `continental_grid` (must be Raster," + " str, or array_like)" ) from e if (time != graster.time) and (not ignore_warnings): raise RuntimeWarning( "`continental_grid.time` ({}) ".format(graster.time) + "does not match `time` ({})".format(time) ) # Obtain trench data. trench_data = self.tessellate_subduction_zones( time, ignore_warnings=ignore_warnings, use_ptt=use_ptt, include_network_boundaries=include_network_boundaries, convergence_threshold_in_cm_per_yr=convergence_threshold_in_cm_per_yr, ) # Extract trench data trench_normal_azimuthal_angle = trench_data[:, 7] trench_arcseg = trench_data[:, 6] trench_pt_lon = trench_data[:, 0] trench_pt_lat = trench_data[:, 1] # Modify the trench-arc distance using the geocentric radius arc_distance = trench_arc_distance / ( _tools.geocentric_radius(trench_pt_lat) / 1000 ) # Project trench points out along trench-arc distance, and obtain their new lat-lon coordinates dlon = arc_distance * np.sin(np.radians(trench_normal_azimuthal_angle)) dlat = arc_distance * np.cos(np.radians(trench_normal_azimuthal_angle)) ilon = trench_pt_lon + np.degrees(dlon) ilat = trench_pt_lat + np.degrees(dlat) # Linearly interpolate projected points onto continental grids, and collect the indices of points that lie # within the grids. sampled_points = graster.interpolate( ilon, ilat, method="linear", return_indices=False, ) continental_indices = np.where(sampled_points > 0) point_lats = ilat[continental_indices] point_radii = _tools.geocentric_radius(point_lats) * 1.0e-3 # km segment_arclens = np.deg2rad(trench_arcseg[continental_indices]) segment_lengths = point_radii * segment_arclens return np.sum(segment_lengths) def _ridge_spreading_rates( self, time, uniform_point_spacing_radians, velocity_delta_time, anchor_plate_id, spreading_feature_types, transform_segment_deviation_in_radians, include_network_boundaries, divergence_threshold_in_cm_per_yr, output_obliquity_and_normal_and_left_right_plates, ): # # This is essentially a replacement for 'ptt.ridge_spreading_rate.spreading_rates()'. # # Instead of calculating spreading rates along mid-ocean ridges using left/right plate IDs, # it uses pyGPlates 1.0 functionality that calculates statistics along plate boundaries # (such as plate velocities, from which divergence spreading velocity can be obtained). # # Note that this function has an advantage over 'ptt.ridge_spreading_rate.spreading_rates()'. # It can work on all plate boundaries, not just those that are spreading (eg, have left/right plate IDs). # This is because it uses plate velocities to calculate divergence (and hence spreading rates). # # Generate statistics at uniformly spaced points along plate boundaries. plate_boundary_statistics = self.topological_snapshot( time, anchor_plate_id=anchor_plate_id, # if None then uses 'self.anchor_plate_id' (default anchor plate of 'self.rotation_model') # Ignore topological slab boundaries since they are not *plate* boundaries # (useful when 'spreading_feature_types' is None, and hence all plate boundaries are considered)... include_topological_slab_boundaries=False, ).calculate_plate_boundary_statistics( uniform_point_spacing_radians, first_uniform_point_spacing_radians=0, velocity_delta_time=velocity_delta_time, velocity_units=pygplates.VelocityUnits.cms_per_yr, include_network_boundaries=include_network_boundaries, boundary_section_filter=spreading_feature_types, ) ridge_data = [] for stat in plate_boundary_statistics: # Reject point if there's not a plate (or network) on both the left and right sides. if not stat.convergence_velocity: continue # If requested, reject point if it's not diverging within specified threshold. if divergence_threshold_in_cm_per_yr is not None: # Note that we use the 'orthogonal' component of velocity vector. if ( -stat.convergence_velocity_orthogonal < divergence_threshold_in_cm_per_yr ): continue if ( output_obliquity_and_normal_and_left_right_plates or transform_segment_deviation_in_radians is not None ): # Convert obliquity from the range [-pi, pi] to [0, pi/2]. # We're only interested in the deviation angle from the normal line (positive or negative normal direction). spreading_obliquity = np.abs( stat.convergence_velocity_obliquity ) # not interested in clockwise vs anti-clockwise if spreading_obliquity > 0.5 * np.pi: spreading_obliquity = ( np.pi - spreading_obliquity ) # angle relative to negative normal direction # If a transform segment deviation was specified then we need to reject transform segments. if transform_segment_deviation_in_radians is not None: # Reject if spreading direction is too oblique compared to the plate boundary normal. # # Note: If there is zero spreading then we don't actually have an obliquity. # In which case we reject the current point to match the behaviour of # 'ptt.ridge_spreading_rate.spreading_rates()' which rejects zero spreading stage rotations. if ( stat.convergence_velocity.is_zero_magnitude() or spreading_obliquity > transform_segment_deviation_in_radians ): continue lat, lon = stat.boundary_point.to_lat_lon() spreading_velocity = stat.convergence_velocity_magnitude if output_obliquity_and_normal_and_left_right_plates: # Get the left plate ID from resolved topological boundary (or network). if stat.left_plate.located_in_resolved_boundary(): left_plate_id = ( stat.left_plate.located_in_resolved_boundary() .get_feature() .get_reconstruction_plate_id() ) else: left_plate_id = ( stat.left_plate.located_in_resolved_network() .get_feature() .get_reconstruction_plate_id() ) # Get the right plate ID from resolved topological boundary (or network). if stat.right_plate.located_in_resolved_boundary(): right_plate_id = ( stat.right_plate.located_in_resolved_boundary() .get_feature() .get_reconstruction_plate_id() ) else: right_plate_id = ( stat.right_plate.located_in_resolved_network() .get_feature() .get_reconstruction_plate_id() ) ridge_data.append( ( lon, lat, spreading_velocity, np.degrees(spreading_obliquity), np.degrees(stat.boundary_length), np.degrees(stat.boundary_normal_azimuth), left_plate_id, right_plate_id, ) ) else: ridge_data.append( ( lon, lat, spreading_velocity, np.degrees(stat.boundary_length), ) ) return ridge_data def tessellate_mid_ocean_ridges( self, time, tessellation_threshold_radians=0.001, ignore_warnings=False, return_geodataframe=False, *, use_ptt=False, spreading_feature_types=[pygplates.FeatureType.gpml_mid_ocean_ridge], transform_segment_deviation_in_radians=separate_ridge_transform_segments.DEFAULT_TRANSFORM_SEGMENT_DEVIATION_RADIANS, include_network_boundaries=False, divergence_threshold_in_cm_per_yr=None, output_obliquity_and_normal_and_left_right_plates=False, anchor_plate_id=None, velocity_delta_time=1.0, ): """Samples points along resolved spreading features (e.g. mid-ocean ridges) and calculates spreading rates and lengths of ridge segments at a particular geological time. Resolves topologies at `time` and tessellates all resolved spreading features into points. The transform segments of spreading features are ignored (unless `transform_segment_deviation_in_radians` is `None`). Returns a 4-column vertically stacked tuple with the following data per sampled ridge point (depending on `output_obliquity_and_normal_and_left_right_plates`): If `output_obliquity_and_normal_and_left_right_plates` is `False` (the default): * Col. 0 - longitude of sampled ridge point * Col. 1 - latitude of sampled ridge point * Col. 2 - spreading velocity magnitude (in cm/yr) * Col. 3 - length of arc segment (in degrees) that current point is on If `output_obliquity_and_normal_and_left_right_plates` is `True`: * Col. 0 - longitude of sampled ridge point * Col. 1 - latitude of sampled ridge point * Col. 2 - spreading velocity magnitude (in cm/yr) * Col. 3 - spreading obliquity in degrees (deviation from normal line in range 0 to 90 degrees) * Col. 4 - length of arc segment (in degrees) that current point is on * Col. 5 - azimuth of vector normal to the arc segment in degrees (clockwise starting at North, ie, 0 to 360 degrees) * Col. 6 - left plate ID * Col. 7 - right plate ID Parameters ---------- time : float The reconstruction time (Ma) at which to query spreading rates. tessellation_threshold_radians : float, default=0.001 The threshold sampling distance along the plate boundaries (in radians). ignore_warnings : bool, default=False Choose to ignore warnings from Plate Tectonic Tools' ridge_spreading_rate workflow (if `use_ptt` is `True`). return_geodataframe : bool, default=False Choose to return data in a geopandas.GeoDataFrame. use_ptt : bool, default=False If set to `True` then uses Plate Tectonic Tools' `ridge_spreading_rate` workflow to calculate ridge spreading rates (which uses the spreading stage rotation of the left/right plate IDs calculate spreading velocities). If set to `False` then uses plate divergence to calculate ridge spreading rates (which samples velocities of the two adjacent boundary plates at each sampled point to calculate spreading velocities). Plate divergence is the more general approach that works along all plate boundaries (not just mid-ocean ridges). spreading_feature_types : <pygplates.FeatureType> or sequence of <pygplates.FeatureType>, default=`pygplates.FeatureType.gpml_mid_ocean_ridge` Only sample points along plate boundaries of the specified feature types. Default is to only sample mid-ocean ridges. You can explicitly specify `None` to sample all plate boundaries, but note that if `use_ptt` is `True` then only plate boundaries that are spreading feature types are sampled (since Plate Tectonic Tools only works on *spreading* plate boundaries, eg, mid-ocean ridges). transform_segment_deviation_in_radians : float, default=<implementation-defined> How much a spreading direction can deviate from the segment normal before it's considered a transform segment (in radians). The default value has been empirically determined to give the best results for typical models. If `None` then the full feature geometry is used (ie, it is not split into ridge and transform segments with the transform segments getting ignored). include_network_boundaries : bool, default=False Whether to calculate spreading rate along network boundaries that are not also plate boundaries (defaults to False). If a deforming network shares a boundary with a plate then it'll get included regardless of this option. Since spreading features occur along *plate* boundaries this would only be an issue if an intra-plate network boundary was incorrectly labelled as spreading. divergence_threshold_in_cm_per_yr : float, optional Only return sample points with an orthogonal (ie, in the spreading geometry's normal direction) diverging velocity above this value (in cm/yr). For example, setting this to `0.0` would remove all converging sample points (leaving only diverging points). This value can be negative which means a small amount of convergence is allowed. If `None` then all (diverging and converging) sample points are returned. This is the default since `spreading_feature_types` is instead used (by default) to include only plate boundaries that are typically diverging (eg, mid-ocean ridges). However, setting `spreading_feature_types` to `None` (and `transform_segment_deviation_in_radians` to `None`) and explicitly specifying this parameter (eg, to `0.0`) can be used to find points along all plate boundaries that are diverging. However, this parameter can only be specified if `use_ptt` is `False`. output_obliquity_and_normal_and_left_right_plates : bool, default=False Whether to also return spreading obliquity, normal azimuth and left/right plates. anchor_plate_id : int, optional Anchor plate ID. Defaults to the current anchor plate ID (`anchor_plate_id` attribute).. velocity_delta_time : float, default=1.0 Velocity delta time used in spreading velocity calculations (defaults to 1 Myr). Returns ------- ridge_data : a list of vertically-stacked tuples The results for all tessellated points sampled along the mid-ocean ridges. The size of the returned list is equal to the number of tessellated points. Each tuple in the list corresponds to a tessellated point and has the following tuple items (depending on `output_obliquity_and_normal_and_left_right_plates`): If `output_obliquity_and_normal_and_left_right_plates` is `False` (the default): * longitude of sampled point * latitude of sampled point * spreading velocity magnitude (in cm/yr) * length of arc segment (in degrees) that sampled point is on If `output_obliquity_and_normal_and_left_right_plates` is `True`: * longitude of sampled point * latitude of sampled point * spreading velocity magnitude (in cm/yr) * spreading obliquity in degrees (deviation from normal line in range 0 to 90 degrees) * length of arc segment (in degrees) that sampled point is on * azimuth of vector normal to the arc segment in degrees (clockwise starting at North, ie, 0 to 360 degrees) * left plate ID * right plate ID Raises ------ ValueError If topology features have not been set in this `PlateReconstruction`. ValueError If `use_ptt` is `True` and `divergence_threshold_in_cm_per_yr` is not `None`. Notes ----- If `use_ptt` is False then each ridge segment is sampled at *exactly* uniform intervals along its length such that the sampled points have a uniform spacing (along each ridge segment polyline) that is *equal* to `tessellation_threshold_radians`. If `use_ptt` is True then each ridge segment is sampled at *approximately* uniform intervals along its length such that the sampled points have a uniform spacing (along each ridge segment polyline) that is *less than or equal to* `tessellation_threshold_radians`. Examples -------- To sample points along mid-ocean ridges at 50Ma, but ignoring the transform segments (of the ridges): ridge_data = plate_reconstruction.tessellate_mid_ocean_ridges(50) To do the same, but instead of ignoring transform segments include both ridge and transform segments, but only where orthogonal diverging velocities are greater than 0.2 cm/yr: ridge_data = plate_reconstruction.tessellate_mid_ocean_ridges(50, transform_segment_deviation_in_radians=None, divergence_threshold_in_cm_per_yr=0.2) """ if use_ptt: from . import ptt as _ptt if divergence_threshold_in_cm_per_yr is not None: raise ValueError( "Can only specify 'divergence_threshold_in_cm_per_yr' if 'use_ptt' is False." ) with warnings.catch_warnings(): if ignore_warnings: warnings.simplefilter("ignore") ridge_data = _ptt.ridge_spreading_rate.spreading_rates( self.rotation_model, self._check_topology_features( # Ignore topological slab boundaries since they are not *plate* boundaries # (not really needed since only *spreading* feature types are considered, and # they typically wouldn't get used for a slab's boundary)... include_topological_slab_boundaries=False ), time, tessellation_threshold_radians, spreading_feature_types=spreading_feature_types, transform_segment_deviation_in_radians=transform_segment_deviation_in_radians, velocity_delta_time=velocity_delta_time, anchor_plate_id=anchor_plate_id, # if None then uses 'self.anchor_plate_id' (default anchor plate of 'self.rotation_model') include_network_boundaries=include_network_boundaries, output_obliquity_and_normal_and_left_right_plates=output_obliquity_and_normal_and_left_right_plates, ) else: ridge_data = self._ridge_spreading_rates( time, uniform_point_spacing_radians=tessellation_threshold_radians, velocity_delta_time=velocity_delta_time, anchor_plate_id=anchor_plate_id, # if None then uses 'self.anchor_plate_id' (default anchor plate of 'self.rotation_model') spreading_feature_types=spreading_feature_types, transform_segment_deviation_in_radians=transform_segment_deviation_in_radians, include_network_boundaries=include_network_boundaries, divergence_threshold_in_cm_per_yr=divergence_threshold_in_cm_per_yr, output_obliquity_and_normal_and_left_right_plates=output_obliquity_and_normal_and_left_right_plates, ) if ridge_data: ridge_data = np.vstack(ridge_data) else: # No ridge data. if output_obliquity_and_normal_and_left_right_plates: ridge_data = np.empty((0, 8)) else: ridge_data = np.empty((0, 4)) if return_geodataframe: import geopandas as gpd from shapely import geometry points = [ geometry.Point(lon, lat) for lon, lat in zip(ridge_data[:, 0], ridge_data[:, 1]) ] gdf_data = { "geometry": points, "velocity (cm/yr)": ridge_data[:, 2], } if output_obliquity_and_normal_and_left_right_plates: gdf_data["obliquity (degrees)"] = ridge_data[:, 3] gdf_data["length (degrees)"] = ridge_data[:, 4] gdf_data["normal azimuth (degrees)"] = ridge_data[:, 5] gdf_data["left plate ID"] = ridge_data[:, 6] gdf_data["right plate ID"] = ridge_data[:, 7] else: gdf_data["length (degrees)"] = ridge_data[:, 3] return gpd.GeoDataFrame(gdf_data, geometry="geometry") else: return ridge_data def total_ridge_length( self, time, use_ptt=False, ignore_warnings=False, *, spreading_feature_types=[pygplates.FeatureType.gpml_mid_ocean_ridge], transform_segment_deviation_in_radians=separate_ridge_transform_segments.DEFAULT_TRANSFORM_SEGMENT_DEVIATION_RADIANS, include_network_boundaries=False, divergence_threshold_in_cm_per_yr=None, ): """Calculates the total length of all resolved spreading features (e.g. mid-ocean ridges) at the specified geological time (Ma). Resolves topologies at `time` and tessellates all resolved spreading features into points (see `tessellate_mid_ocean_ridges`). The transform segments of spreading features are ignored (unless *transform_segment_deviation_in_radians* is `None`). Total length is calculated by sampling points along the resolved spreading features (e.g. mid-ocean ridges) and accumulating their lengths (see `tessellate_mid_ocean_ridges`). Scales lengths to kilometres using the geocentric radius (at each sampled point). Parameters ---------- time : int The geological time at which to calculate total mid-ocean ridge lengths. use_ptt : bool, default=False If set to `True` then uses Plate Tectonic Tools' `ridge_spreading_rate` workflow to calculate total ridge length (which uses the spreading stage rotation of the left/right plate IDs to calculate spreading directions - see `transform_segment_deviation_in_radians`). If set to `False` then uses plate divergence to calculate total ridge length (which samples velocities of the two adjacent boundary plates at each sampled point to calculate spreading directions - see `transform_segment_deviation_in_radians`). Plate divergence is the more general approach that works along all plate boundaries (not just mid-ocean ridges). ignore_warnings : bool, default=False Choose to ignore warnings from Plate Tectonic Tools' ridge_spreading_rate workflow (if `use_ptt` is `True`). spreading_feature_types : <pygplates.FeatureType> or sequence of <pygplates.FeatureType>, default=`pygplates.FeatureType.gpml_mid_ocean_ridge` Only count lengths along plate boundaries of the specified feature types. Default is to only sample mid-ocean ridges. You can explicitly specify `None` to sample all plate boundaries, but note that if `use_ptt` is `True` then only plate boundaries that are spreading feature types are sampled (since Plate Tectonic Tools only works on *spreading* plate boundaries, eg, mid-ocean ridges). transform_segment_deviation_in_radians : float, default=<implementation-defined> How much a spreading direction can deviate from the segment normal before it's considered a transform segment (in radians). The default value has been empirically determined to give the best results for typical models. If `None` then the full feature geometry is used (ie, it is not split into ridge and transform segments with the transform segments getting ignored). include_network_boundaries : bool, default=False Whether to count lengths along network boundaries that are not also plate boundaries (defaults to False). If a deforming network shares a boundary with a plate then it'll get included regardless of this option. Since spreading features occur along *plate* boundaries this would only be an issue if an intra-plate network boundary was incorrectly labelled as spreading. divergence_threshold_in_cm_per_yr : float, optional Only count lengths associated with sample points that have an orthogonal (ie, in the spreading geometry's normal direction) diverging velocity above this value (in cm/yr). For example, setting this to `0.0` would remove all converging sample points (leaving only diverging points). This value can be negative which means a small amount of convergence is allowed. If `None` then all (diverging and converging) sample points are counted. This is the default since *spreading_feature_types* is instead used (by default) to include only plate boundaries that are typically diverging (eg, mid-ocean ridges). However, setting `spreading_feature_types` to `None` (and `transform_segment_deviation_in_radians` to `None`) and explicitly specifying this parameter (eg, to `0.0`) can be used to count points along all plate boundaries that are diverging. However, this parameter can only be specified if *use_ptt* is `False`. Returns ------- total_ridge_length_kms : float The total length of global mid-ocean ridges (in kilometres) at the specified time. Raises ------ ValueError If topology features have not been set in this `PlateReconstruction`. ValueError If `use_ptt` is `True` and `divergence_threshold_in_cm_per_yr` is not `None`. Examples -------- To calculate the total length of mid-ocean ridges at 50Ma, but ignoring the transform segments (of the ridges): total_ridge_length_kms = plate_reconstruction.total_ridge_length(50) To do the same, but instead of ignoring transform segments include both ridge and transform segments, but only where orthogonal diverging velocities are greater than 0.2 cm/yr: total_ridge_length_kms = plate_reconstruction.total_ridge_length(50, transform_segment_deviation_in_radians=None, divergence_threshold_in_cm_per_yr=0.2) """ ridge_data = self.tessellate_mid_ocean_ridges( time, ignore_warnings=ignore_warnings, use_ptt=use_ptt, spreading_feature_types=spreading_feature_types, transform_segment_deviation_in_radians=transform_segment_deviation_in_radians, include_network_boundaries=include_network_boundaries, divergence_threshold_in_cm_per_yr=divergence_threshold_in_cm_per_yr, ) ridge_arcseg = ridge_data[:, 3] ridge_pt_lat = ridge_data[:, 1] total_ridge_length_kms = 0 for i, segment in enumerate(ridge_arcseg): earth_radius = _tools.geocentric_radius(ridge_pt_lat[i]) / 1e3 total_ridge_length_kms += np.deg2rad(segment) * earth_radius return total_ridge_length_kms def reconstruct_snapshot( self, reconstructable_features, time, *, anchor_plate_id=None, from_time=0, ): """Create a snapshot of reconstructed regular features (including motion paths and flowlines) at a specific geological time. Parameters ---------- reconstructable_features : str/`os.PathLike`, or a sequence (eg, `list` or `tuple`) of instances of <pygplates.Feature>, or a single instance of <pygplates.Feature>, or an instance of <pygplates.FeatureCollection> Regular reconstructable features (including motion paths and flowlines). Can be provided as a feature collection, or filename, or feature, or sequence of features, or a sequence (eg, list or tuple) of any combination of those four types. time : float, or pygplates.GeoTimeInstant The specific geological time to reconstruct to. anchor_plate_id : int, optional Anchor plate ID. Defaults to the current anchor plate ID (`anchor_plate_id` attribute). from_time : float, default=0 The specific geological time to reconstruct *from*. By default, this is set to present day. If not set to 0 Ma (present day) then the geometry in `feature` is assumed to be a reconstructed snapshot at `from_time`, in which case it is reverse reconstructed to present day before reconstructing to `to_time`. Usually features should contain present day geometry but might contain reconstructed geometry in some cases, such as those generated by the reconstruction export in GPlates. Returns ------- reconstruct_snapshot : pygplates.ReconstructSnapshot A [pygplates.ReconstructSnapshot](https://www.gplates.org/docs/pygplates/generated/pygplates.ReconstructSnapshot) of the specified reconstructable features reconstructed using the internal rotation model to the specified reconstruction time. """ # If the features represent a snapshot at a *past* geological time then we need to reverse reconstruct them # such that they contain present-day geometry (not reconstructed geometry). if from_time != 0: # Extract the reconstructed features and clone them so we don't modify the caller's features. reconstructable_features = [ feature.clone() for feature in pygplates.FeaturesFunctionArgument( reconstructable_features ).get_features() ] # Reverse reconstruct in-place (modifies each feature's geometry). pygplates.reverse_reconstruct( reconstructable_features, self.rotation_model, from_time, anchor_plate_id=anchor_plate_id, # if None then uses 'self.anchor_plate_id' (default anchor plate of 'self.rotation_model') ) return pygplates.ReconstructSnapshot( reconstructable_features, self.rotation_model, time, anchor_plate_id=anchor_plate_id, # if None then uses 'self.anchor_plate_id' (default anchor plate of 'self.rotation_model') ) def reconstruct( self, feature, to_time, from_time=0, anchor_plate_id=None, *, reconstruct_type=pygplates.ReconstructType.feature_geometry, group_with_feature=False, ): """Reconstructs regular geological features, motion paths or flowlines to a specific geological time. Parameters ---------- feature : str/`os.PathLike`, or instance of <pygplates.FeatureCollection>, or <pygplates.Feature>, or sequence of <pygplates.Feature> The geological features to reconstruct. Can be provided as a feature collection, or filename, or feature, or sequence of features, or a sequence (eg, a list or tuple) of any combination of those four types. to_time : float, or pygplates.GeoTimeInstant The specific geological time to reconstruct to. from_time : float, default=0 The specific geological time to reconstruct *from*. By default, this is set to present day. If not set to 0 Ma (present day) then the geometry in `feature` is assumed to be a reconstructed snapshot at `from_time`, in which case it is reverse reconstructed to present day before reconstructing to `to_time`. Usually features should contain present day geometry but might contain reconstructed geometry in some cases, such as those generated by the reconstruction export in GPlates. anchor_plate_id : int, optional Anchor plate ID. Defaults to the current anchor plate ID (`anchor_plate_id` attribute). reconstruct_type : pygplates.ReconstructType, default=pygplates.ReconstructType.feature_geometry The specific reconstruction type to generate based on input feature geometry type. Can be provided as pygplates.ReconstructType.feature_geometry to only reconstruct regular feature geometries, or pygplates.ReconstructType.motion_path to only reconstruct motion path features, or pygplates.ReconstructType.flowline to only reconstruct flowline features. Generates `pygplates.ReconstructedFeatureGeometry>`s, or `pygplates.ReconstructedMotionPath`s, or `pygplates.ReconstructedFlowline`s respectively. group_with_feature : bool, default=False Used to group reconstructed geometries with their features. This can be useful when a feature has more than one geometry and hence more than one reconstructed geometry. The returned list then becomes a list of tuples where each tuple contains a `pygplates.Feature` and a ``list`` of reconstructed geometries. Returns ------- reconstructed_features : list The reconstructed geological features. The reconstructed geometries are output in the same order as that of their respective input features (in the parameter `features`). This includes the order across any input feature collections or files. If `group_with_feature` is True then the list contains tuples that group each `pygplates.Feature` with a list of its reconstructed geometries. See Also -------- reconstruct_snapshot """ reconstruct_snapshot = self.reconstruct_snapshot( feature, to_time, anchor_plate_id=anchor_plate_id, # if None then uses 'self.anchor_plate_id' (default anchor plate of 'self.rotation_model') from_time=from_time, ) if group_with_feature: # These are always sorted in same order as the input features. return reconstruct_snapshot.get_reconstructed_features(reconstruct_type) else: return reconstruct_snapshot.get_reconstructed_geometries( reconstruct_type, same_order_as_reconstructable_features=True ) def get_point_velocities( self, lons, lats, time, delta_time=1.0, *, velocity_delta_time_type=pygplates.VelocityDeltaTimeType.t_plus_delta_t_to_t, velocity_units=pygplates.VelocityUnits.kms_per_my, earth_radius_in_kms=pygplates.Earth.mean_radius_in_kms, include_networks=True, include_topological_slab_boundaries=False, anchor_plate_id=None, return_east_north_arrays=False, ): """Calculates the north and east components of the velocity vector (in kms/myr) for each specified point (from `lons` and `lats`) at a particular geological `time`. Parameters ---------- lons : array A 1D array of point data's longitudes. lats : array A 1D array of point data's latitudes. time : float The specific geological time (Ma) at which to calculate plate velocities. delta_time : float, default=1.0 The time interval used for velocity calculations. 1.0Ma by default. velocity_delta_time_type : {pygplates.VelocityDeltaTimeType.t_plus_delta_t_to_t, pygplates.VelocityDeltaTimeType.t_to_t_minus_delta_t, pygplates.VelocityDeltaTimeType.t_plus_minus_half_delta_t}, default=pygplates.VelocityDeltaTimeType.t_plus_delta_t_to_t How the two velocity times are calculated relative to `time` (defaults to ``[time + velocity_delta_time, time]``). velocity_units : {pygplates.VelocityUnits.cms_per_yr, pygplates.VelocityUnits.kms_per_my}, default=pygplates.VelocityUnits.kms_per_my Whether to return velocities in centimetres per year or kilometres per million years (defaults to kilometres per million years). earth_radius_in_kms : float, default=pygplates.Earth.mean_radius_in_kms Radius of the Earth in kilometres. This is only used to calculate velocities (strain rates always use ``pygplates.Earth.equatorial_radius_in_kms``). include_networks : bool, default=True Whether to include deforming networks when calculating velocities. By default they are included (and also given precedence since they typically overlay a rigid plate). include_topological_slab_boundaries : bool, default=False Whether to include features of type `gpml:TopologicalSlabBoundary` when calculating velocities. By default they are **not** included (they tend to overlay a rigid plate which should instead be used to calculate plate velocity). anchor_plate_id : int, optional Anchor plate ID. Defaults to the current anchor plate ID (`anchor_plate_id` attribute). return_east_north_arrays : bool, default=False Return the velocities as arrays separately containing the east and north components of the velocities. Note that setting this to True matches the output of `points.plate_velocity`. Returns ------- north_east_velocities : 2D ndarray Only provided if `return_east_north_arrays` is False. Each array element contains the (north, east) velocity components of a single point. east_velocities, north_velocities : 1D ndarray Only provided if `return_east_north_arrays` is True. The east and north components of velocities as separate arrays. These are also ordered (east, north) instead of (north, east). Raises ------ ValueError If topology features have not been set in this `PlateReconstruction`. Notes ----- The velocities are in *kilometres per million years* by default (not *centimetres per year*, the default in `Point.plate_velocity`). This difference is maintained for backward compatibility. For each velocity, the *north* component is first followed by the *east* component. This is different to `Point.plate_velocity` where the *east* component is first. This difference is maintained for backward compatibility. """ # Add points to a multipoint geometry points = [pygplates.PointOnSphere(lat, lon) for lat, lon in zip(lats, lons)] topological_snapshot = self.topological_snapshot( time, anchor_plate_id=anchor_plate_id, # if None then uses 'self.anchor_plate_id' (default anchor plate of 'self.rotation_model') include_topological_slab_boundaries=include_topological_slab_boundaries, ) # If requested, exclude resolved topological *networks*. resolve_topology_types = pygplates.ResolveTopologyType.boundary if include_networks: resolve_topology_types = ( resolve_topology_types | pygplates.ResolveTopologyType.network ) point_velocities = topological_snapshot.get_point_velocities( points, resolve_topology_types=resolve_topology_types, velocity_delta_time=delta_time, velocity_delta_time_type=velocity_delta_time_type, velocity_units=velocity_units, earth_radius_in_kms=earth_radius_in_kms, ) # Replace any missing velocities with zero velocity. # # If a point does not intersect a topological plate (or network) then its velocity is None. for point_index in range(len(points)): if point_velocities[point_index] is None: point_velocities[point_index] = pygplates.Vector3D.zero # Convert global 3D velocity vectors to local (North, East, Down) vectors (one per point). point_velocities_north_east_down = ( pygplates.LocalCartesian.convert_from_geocentric_to_north_east_down( points, point_velocities ) ) if return_east_north_arrays: # Extract the East and North velocity components into separate arrays. east_velocities = [ned.get_y() for ned in point_velocities_north_east_down] north_velocities = [ned.get_x() for ned in point_velocities_north_east_down] # Note: This is the opposite order (ie, (east,north) instead of (north,east)). return np.array(east_velocities), np.array(north_velocities) else: # Extract the North and East velocity components into a single array. north_east_velocities = [ (ned.get_x(), ned.get_y()) for ned in point_velocities_north_east_down ] return np.array(north_east_velocities) def create_motion_path( self, lons, lats, time_array, plate_id=None, anchor_plate_id=None, return_rate_of_motion=False, ): """Create a path of points to mark the trajectory of a plate's motion through geological time. Parameters ---------- lons : arr An array containing the longitudes of seed points on a plate in motion. lats : arr An array containing the latitudes of seed points on a plate in motion. time_array : arr An array of reconstruction times at which to determine the trajectory of a point on a plate. For example: import numpy as np min_time = 30 max_time = 100 time_step = 2.5 time_array = np.arange(min_time, max_time + time_step, time_step) plate_id : int, optional The ID of the moving plate. If this is not passed, the plate ID of the seed points are ascertained using pygplates' `PlatePartitioner`. anchor_plate_id : int, optional The ID of the anchor plate. Defaults to the default anchor plate (specified in `__init__` or set with `anchor_plate_id` attribute). return_rate_of_motion : bool, default=False Choose whether to return the rate of plate motion through time for each Returns ------- rlons : ndarray An n-dimensional array with columns containing the longitudes of the seed points at each timestep in `time_array`. There are n columns for n seed points. rlats : ndarray An n-dimensional array with columns containing the latitudes of the seed points at each timestep in `time_array`. There are n columns for n seed points. StepTimes StepRates Raises ------ ValueError If *plate_id* is `None` and topology features have not been set in this `PlateReconstruction`. Examples -------- To access the latitudes and longitudes of each seed point's motion path: for i in np.arange(0,len(seed_points)): current_lons = lon[:,i] current_lats = lat[:,i] """ lons = np.atleast_1d(lons) lats = np.atleast_1d(lats) time_array = np.atleast_1d(time_array) # ndarrays to fill with reconstructed points and # rates of motion (if requested) rlons = np.empty((len(time_array), len(lons))) rlats = np.empty((len(time_array), len(lons))) if plate_id is None: query_plate_id = True else: query_plate_id = False plate_ids = np.ones(len(lons), dtype=int) * plate_id seed_points = zip(lats, lons) if return_rate_of_motion is True: StepTimes = np.empty(((len(time_array) - 1) * 2, len(lons))) StepRates = np.empty(((len(time_array) - 1) * 2, len(lons))) for i, lat_lon in enumerate(seed_points): seed_points_at_digitisation_time = pygplates.PointOnSphere( pygplates.LatLonPoint(float(lat_lon[0]), float(lat_lon[1])) ) # Allocate the present-day plate ID to the PointOnSphere if # it was not given. if query_plate_id: plate_id = _tools.plate_partitioner_for_point( lat_lon, self._check_topology_features(), self.rotation_model ) else: plate_id = plate_ids[i] # Create the motion path feature. enforce float and int for C++ signature. motion_path_feature = pygplates.Feature.create_motion_path( seed_points_at_digitisation_time, time_array, valid_time=(time_array.max(), time_array.min()), relative_plate=( # if None then uses 'self.anchor_plate_id' (default anchor plate of 'self.rotation_model') anchor_plate_id if anchor_plate_id is not None else self.anchor_plate_id ), reconstruction_plate_id=int(plate_id), ) reconstructed_motion_paths = self.reconstruct( motion_path_feature, to_time=0, reconstruct_type=pygplates.ReconstructType.motion_path, anchor_plate_id=anchor_plate_id, # if None then uses 'self.anchor_plate_id' (default anchor plate of 'self.rotation_model') ) # Turn motion paths in to lat-lon coordinates for reconstructed_motion_path in reconstructed_motion_paths: trail = reconstructed_motion_path.get_motion_path().to_lat_lon_array() lon, lat = np.flipud(trail[:, 1]), np.flipud(trail[:, 0]) rlons[:, i] = lon rlats[:, i] = lat # Obtain step-plot coordinates for rate of motion if return_rate_of_motion is True: # Get timestep TimeStep = [] for j in range(len(time_array) - 1): diff = time_array[j + 1] - time_array[j] TimeStep.append(diff) # Iterate over each segment in the reconstructed motion path, get the distance travelled by the moving # plate relative to the fixed plate in each time step Dist = [] for reconstructed_motion_path in reconstructed_motion_paths: for ( segment ) in reconstructed_motion_path.get_motion_path().get_segments(): Dist.append( segment.get_arc_length() * _tools.geocentric_radius( segment.get_start_point().to_lat_lon()[0] ) / 1e3 ) # Note that the motion path coordinates come out starting with the oldest time and working forwards # So, to match our 'times' array, we flip the order Dist = np.flipud(Dist) # Get rate of motion as distance per Myr Rate = np.asarray(Dist) / TimeStep # Manipulate arrays to get a step plot StepRate = np.zeros(len(Rate) * 2) StepRate[::2] = Rate StepRate[1::2] = Rate StepTime = np.zeros(len(Rate) * 2) StepTime[::2] = time_array[:-1] StepTime[1::2] = time_array[1:] # Append the nth point's step time and step rate coordinates to the ndarray StepTimes[:, i] = StepTime StepRates[:, i] = StepRate * 0.1 # cm/yr # Obseleted by Lauren's changes above (though it is more efficient) # multiply arc length of the motion path segment by a latitude-dependent Earth radius # use latitude of the segment start point # distance.append( segment.get_arc_length() * _tools.geocentric_radius(segment.get_start_point().to_lat_lon()[0]) / 1e3) # rate = np.asarray(distance)/np.diff(time_array) # rates[:,i] = np.flipud(rate) # rates *= 0.1 # cm/yr if return_rate_of_motion is True: return ( np.squeeze(rlons), np.squeeze(rlats), np.squeeze(StepTimes), np.squeeze(StepRates), ) else: return np.squeeze(rlons), np.squeeze(rlats) def create_flowline( self, lons, lats, time_array, left_plate_ID, right_plate_ID, return_rate_of_motion=False, ): """Create a path of points to track plate motion away from spreading ridges over time using half-stage rotations. Parameters ---------- lons : arr An array of longitudes of points along spreading ridges. lats : arr An array of latitudes of points along spreading ridges. time_array : arr A list of times to obtain seed point locations at. left_plate_ID : int The plate ID of the polygon to the left of the spreading ridge. right_plate_ID : int The plate ID of the polygon to the right of the spreading ridge. return_rate_of_motion : bool, default False Choose whether to return a step time and step rate array for a step plot of motion. Returns ------- left_lon : ndarray The longitudes of the __left__ flowline for n seed points. There are n columns for n seed points, and m rows for m time steps in `time_array`. left_lat : ndarray The latitudes of the __left__ flowline of n seed points. There are n columns for n seed points, and m rows for m time steps in `time_array`. right_lon : ndarray The longitudes of the __right__ flowline of n seed points. There are n columns for n seed points, and m rows for m time steps in `time_array`. right_lat : ndarray The latitudes of the __right__ flowline of n seed points. There are n columns for n seed points, and m rows for m time steps in `time_array`. Examples -------- To access the ith seed point's left and right latitudes and longitudes: for i in np.arange(0,len(seed_points)): left_flowline_longitudes = left_lon[:,i] left_flowline_latitudes = left_lat[:,i] right_flowline_longitudes = right_lon[:,i] right_flowline_latitudes = right_lat[:,i] """ lats = np.atleast_1d(lats) lons = np.atleast_1d(lons) time_array = np.atleast_1d(time_array) seed_points = list(zip(lats, lons)) multi_point = pygplates.MultiPointOnSphere(seed_points) start = 0 if time_array[0] != 0: start = 1 time_array = np.hstack([[0], time_array]) # Create the flowline feature flowline_feature = pygplates.Feature.create_flowline( multi_point, time_array.tolist(), valid_time=(time_array.max(), time_array.min()), left_plate=left_plate_ID, right_plate=right_plate_ID, ) # reconstruct the flowline in present-day coordinates reconstructed_flowlines = self.reconstruct( flowline_feature, to_time=0, reconstruct_type=pygplates.ReconstructType.flowline, ) # Wrap things to the dateline, to avoid plotting artefacts. date_line_wrapper = pygplates.DateLineWrapper() # Create lat-lon ndarrays to store the left and right lats and lons of flowlines left_lon = np.empty((len(time_array), len(lons))) left_lat = np.empty((len(time_array), len(lons))) right_lon = np.empty((len(time_array), len(lons))) right_lat = np.empty((len(time_array), len(lons))) StepTimes = np.empty(((len(time_array) - 1) * 2, len(lons))) StepRates = np.empty(((len(time_array) - 1) * 2, len(lons))) # Iterate over the reconstructed flowlines. Each seed point results in a 'left' and 'right' flowline for i, reconstructed_flowline in enumerate(reconstructed_flowlines): # Get the points for the left flowline only left_latlon = reconstructed_flowline.get_left_flowline().to_lat_lon_array() left_lon[:, i] = left_latlon[:, 1] left_lat[:, i] = left_latlon[:, 0] # Repeat for the right flowline points right_latlon = ( reconstructed_flowline.get_right_flowline().to_lat_lon_array() ) right_lon[:, i] = right_latlon[:, 1] right_lat[:, i] = right_latlon[:, 0] if return_rate_of_motion: for i, reconstructed_motion_path in enumerate(reconstructed_flowlines): distance = [] for ( segment ) in reconstructed_motion_path.get_left_flowline().get_segments(): distance.append( segment.get_arc_length() * _tools.geocentric_radius( segment.get_start_point().to_lat_lon()[0] ) / 1e3 ) # Get rate of motion as distance per Myr # Need to multiply rate by 2, since flowlines give us half-spreading rate time_step = time_array[1] - time_array[0] Rate = ( np.asarray(distance) / time_step ) * 2 # since we created the flowline at X increment # Manipulate arrays to get a step plot StepRate = np.zeros(len(Rate) * 2) StepRate[::2] = Rate StepRate[1::2] = Rate StepTime = np.zeros(len(Rate) * 2) StepTime[::2] = time_array[:-1] StepTime[1::2] = time_array[1:] # Append the nth point's step time and step rate coordinates to the ndarray StepTimes[:, i] = StepTime StepRates[:, i] = StepRate * 0.1 # cm/yr return ( left_lon[start:], left_lat[start:], right_lon[start:], right_lat[start:], StepTimes, StepRates, ) else: return ( left_lon[start:], left_lat[start:], right_lon[start:], right_lat[start:], )Instance variables
prop anchor_plate_id-
Anchor plate ID for reconstruction. Must be an integer >= 0.
Expand source code
@property
def anchor_plate_id(self):
    """Anchor plate ID for reconstruction. Must be an integer >= 0."""
    # The default anchor plate comes from the RotationModel.
    return self.rotation_model.get_default_anchor_plate_id()
Methods
def create_flowline(self, lons, lats, time_array, left_plate_ID, right_plate_ID, return_rate_of_motion=False)-
Create a path of points to track plate motion away from spreading ridges over time using half-stage rotations.
Parameters
lons:arr- An array of longitudes of points along spreading ridges.
lats:arr- An array of latitudes of points along spreading ridges.
time_array:arr- A list of times to obtain seed point locations at.
left_plate_ID:int- The plate ID of the polygon to the left of the spreading ridge.
right_plate_ID:int- The plate ID of the polygon to the right of the spreading ridge.
return_rate_of_motion:bool, defaultFalse- Choose whether to return a step time and step rate array for a step plot of motion.
Returns
left_lon:ndarray- The longitudes of the left flowline for n seed points.
There are n columns for n seed points, and m rows
for m time steps in
time_array. left_lat:ndarray- The latitudes of the left flowline of n seed points.
There are n columns for n seed points, and m rows
for m time steps in
time_array. right_lon:ndarray- The longitudes of the right flowline of n seed points.
There are n columns for n seed points, and m rows
for m time steps in
time_array. right_lat:ndarray- The latitudes of the right flowline of n seed points.
There are n columns for n seed points, and m rows
for m time steps in
time_array.
Examples
To access the ith seed point's left and right latitudes and longitudes:
for i in np.arange(0,len(seed_points)):
    left_flowline_longitudes = left_lon[:,i]
    left_flowline_latitudes = left_lat[:,i]
    right_flowline_longitudes = right_lon[:,i]
    right_flowline_latitudes = right_lat[:,i]
def create_motion_path(self, lons, lats, time_array, plate_id=None, anchor_plate_id=None, return_rate_of_motion=False)-
Create a path of points to mark the trajectory of a plate's motion through geological time.
Parameters
lons:arr- An array containing the longitudes of seed points on a plate in motion.
lats:arr- An array containing the latitudes of seed points on a plate in motion.
time_array:arr- An array of reconstruction times at which to determine the trajectory
of a point on a plate. For example:
import numpy as np min_time = 30 max_time = 100 time_step = 2.5 time_array = np.arange(min_time, max_time + time_step, time_step) plate_id:int, optional- The ID of the moving plate. If this is not passed, the plate ID of the
seed points are ascertained using pygplates'
PlatePartitioner. anchor_plate_id:int, optional- The ID of the anchor plate. Defaults to the default anchor plate
(specified in
__init__or set withanchor_plate_idattribute). return_rate_of_motion:bool, default=False- Choose whether to return the rate of plate motion through time for each
Returns
rlons:ndarray- An n-dimensional array with columns containing the longitudes of
the seed points at each timestep in
time_array. There are n columns for n seed points. rlats:ndarray- An n-dimensional array with columns containing the latitudes of
the seed points at each timestep in
time_array. There are n columns for n seed points. StepTimesStepRates
Raises
ValueError- If plate_id is
Noneand topology features have not been set in thisPlateReconstruction.
Examples
To access the latitudes and longitudes of each seed point's motion path:
for i in np.arange(0,len(seed_points)):
    current_lons = lon[:,i]
    current_lats = lat[:,i]
def crustal_production_destruction_rate(self, time, uniform_point_spacing_radians=0.001, divergence_velocity_threshold_in_cms_per_yr=0.0, convergence_velocity_threshold_in_cms_per_yr=0.0, *, first_uniform_point_spacing_radians=None, velocity_delta_time=1.0, velocity_delta_time_type=pygplates.pygplates.VelocityDeltaTimeType.t_plus_delta_t_to_t, include_network_boundaries=False, include_topological_slab_boundaries=False, boundary_section_filter=None)-
Calculates the total crustal production and destruction rates (in km^2/yr) of divergent and convergent plate boundaries at the specified geological time (Ma).
Resolves topologies at
timeand uniformly samples all plate boundaries into divergent and convergent boundary points.Total crustal production (and destruction) rate is then calculated by accumulating divergent (and convergent) orthogonal velocities multiplied by their local boundary lengths. Velocities and lengths are scaled using the geocentric radius (at each divergent and convergent sampled point).
Parameters
time:float- The reconstruction time (Ma) at which to query divergent/convergent plate boundaries.
uniform_point_spacing_radians:float, default=0.001- The spacing between uniform points along plate boundaries (in radians).
divergence_velocity_threshold_in_cms_per_yr:float, default=0.0- Orthogonal (ie, in the direction of boundary normal) velocity threshold for diverging sample points.
Points with an orthogonal diverging velocity above this value will accumulate crustal production.
The default is
0.0which removes all converging sample points (leaving only diverging points). This value can be negative which means a small amount of convergence is allowed for the diverging points. The units should be in cm/yr. convergence_velocity_threshold_in_cms_per_yr:float, default=0.0- Orthogonal (ie, in the direction of boundary normal) velocity threshold for converging sample points.
Points with an orthogonal converging velocity above this value will accumulate crustal destruction.
The default is
0.0which removes all diverging sample points (leaving only converging points). This value can be negative which means a small amount of divergence is allowed for the converging points. The units should be in cm/yr. first_uniform_point_spacing_radians:float, optional- Spacing of first uniform point in each resolved topological section (in radians) - see
divergent_convergent_plate_boundaries()for more details. Defaults to half ofuniform_point_spacing_radians. velocity_delta_time:float, default=1.0- The time delta used to calculate velocities (defaults to 1 Myr).
velocity_delta_time_type:{pygplates.VelocityDeltaTimeType.t_plus_delta_t_to_t, pygplates.VelocityDeltaTimeType.t_to_t_minus_delta_t, pygplates.VelocityDeltaTimeType.t_plus_minus_half_delta_t}, default=pygplates.VelocityDeltaTimeType.t_plus_delta_t_to_t- How the two velocity times are calculated relative to
time(defaults to[time + velocity_delta_time, time]). include_network_boundaries:bool, default=False- Whether to sample along network boundaries that are not also plate boundaries (defaults to False). If a deforming network shares a boundary with a plate then it'll get included regardless of this option.
include_topological_slab_boundaries:bool, default=False- Whether to sample along slab boundaries (features of type
gpml:TopologicalSlabBoundary). By default they are not sampled since they are not plate boundaries. boundary_section_filter- Same as the
boundary_section_filterargument indivergent_convergent_plate_boundaries(). Defaults toNone(meaning all plate boundaries are included by default).
Returns
total_crustal_production_rate_in_km_2_per_yr:float- The total rate of crustal production at divergent plate boundaries (in km^2/yr) at the specified
time. total_crustal_destruction_rate_in_km_2_per_yr:float- The total rate of crustal destruction at convergent plate boundaries (in km^2/yr) at the specified
time.
Raises
ValueError- If topology features have not been set in this
PlateReconstruction.
Examples
To calculate total crustal production/destruction along plate boundaries at 50Ma:
total_crustal_production_rate_in_km_2_per_yr, total_crustal_destruction_rate_in_km_2_per_yr = plate_reconstruction.crustal_production_destruction_rate(50)To do the same, but restrict convergence to points where orthogonal converging velocities are greater than 0.2 cm/yr (with divergence remaining unchanged with the default 0.0 threshold):
total_crustal_production_rate_in_km_2_per_yr, total_crustal_destruction_rate_in_km_2_per_yr = plate_reconstruction.crustal_production_destruction_rate(50,
        convergence_velocity_threshold_in_cms_per_yr=0.2)
def divergent_convergent_plate_boundaries(self, time, uniform_point_spacing_radians=0.001, divergence_velocity_threshold=0.0, convergence_velocity_threshold=0.0, *, first_uniform_point_spacing_radians=None, anchor_plate_id=None, velocity_delta_time=1.0, velocity_delta_time_type=pygplates.pygplates.VelocityDeltaTimeType.t_plus_delta_t_to_t, velocity_units=pygplates.pygplates.VelocityUnits.cms_per_yr, earth_radius_in_kms=6371.009, include_network_boundaries=False, include_topological_slab_boundaries=False, boundary_section_filter=None)-
Samples points uniformly along plate boundaries and calculates statistics at diverging/converging locations at a particular geological time.
Resolves topologies at
time, uniformly samples all plate boundaries into points and returns two lists of pygplates.PlateBoundaryStatistic. The first list represents sample points where the plates are diverging, and the second where plates are converging.Parameters
time:float- The reconstruction time (Ma) at which to query divergent/convergent plate boundaries.
uniform_point_spacing_radians:float, default=0.001- The spacing between uniform points along plate boundaries (in radians).
divergence_velocity_threshold:float, default=0.0- Orthogonal (ie, in the direction of boundary normal) velocity threshold for diverging sample points.
Points with an orthogonal diverging velocity above this value will be returned in
diverging_data. The default is0.0which removes all converging sample points (leaving only diverging points). This value can be negative which means a small amount of convergence is allowed for the diverging points. The units should match the units ofvelocity_units(eg, if that's cm/yr then this threshold should also be in cm/yr). convergence_velocity_threshold:float, default=0.0- Orthogonal (ie, in the direction of boundary normal) velocity threshold for converging sample points.
Points with an orthogonal converging velocity above this value will be returned in
converging_data. The default is0.0which removes all diverging sample points (leaving only converging points). This value can be negative which means a small amount of divergence is allowed for the converging points. The units should match the units ofvelocity_units(eg, if that's cm/yr then this threshold should also be in cm/yr). first_uniform_point_spacing_radians:float, optional- Spacing of first uniform point in each resolved topological section (in radians) - see
pygplates.TopologicalSnapshot.calculate_plate_boundary_statistics()
for more details. Defaults to half of
uniform_point_spacing_radians. anchor_plate_id:int, optional- Anchor plate ID. Defaults to the current anchor plate ID (
anchor_plate_idattribute). velocity_delta_time:float, default=1.0- The time delta used to calculate velocities (defaults to 1 Myr).
velocity_delta_time_type:{pygplates.VelocityDeltaTimeType.t_plus_delta_t_to_t, pygplates.VelocityDeltaTimeType.t_to_t_minus_delta_t, pygplates.VelocityDeltaTimeType.t_plus_minus_half_delta_t}, default=pygplates.VelocityDeltaTimeType.t_plus_delta_t_to_t- How the two velocity times are calculated relative to
time(defaults to[time + velocity_delta_time, time]). velocity_units:{pygplates.VelocityUnits.cms_per_yr, pygplates.VelocityUnits.kms_per_my}, default=pygplates.VelocityUnits.cms_per_yr- Whether to return velocities in centimetres per year or kilometres per million years (defaults to centimetres per year).
earth_radius_in_kms:float, default=pygplates.Earth.mean_radius_in_kms- Radius of the Earth in kilometres.
This is only used to calculate velocities (strain rates always use
pygplates.Earth.equatorial_radius_in_kms). include_network_boundaries:bool, default=False- Whether to sample along network boundaries that are not also plate boundaries (defaults to False). If a deforming network shares a boundary with a plate then it'll get included regardless of this option.
include_topological_slab_boundaries:bool, default=False- Whether to sample along slab boundaries (features of type
gpml:TopologicalSlabBoundary). By default they are not sampled since they are not plate boundaries. boundary_section_filter- Same as the
boundary_section_filterargument in pygplates.TopologicalSnapshot.calculate_plate_boundary_statistics(). Defaults toNone(meaning all plate boundaries are included by default).
Returns
diverging_data:listofpygplates.PlateBoundaryStatistic- The results for all uniformly sampled points along plate boundaries that are diverging relative to
divergence_threshold. The size of the returned list is equal to the number of sampled points that are diverging. Each pygplates.PlateBoundaryStatistic is guaranteed to have a valid (ie, notNone) convergence velocity. converging_data:listofpygplates.PlateBoundaryStatistic- The results for all uniformly sampled points along plate boundaries that are converging relative to
convergence_threshold. The size of the returned list is equal to the number of sampled points that are converging. Each pygplates.PlateBoundaryStatistic is guaranteed to have a valid (ie, notNone) convergence velocity.
Raises
ValueError- If topology features have not been set in this
PlateReconstruction.
Examples
To sample diverging/converging points along plate boundaries at 50Ma:
diverging_data, converging_data = plate_reconstruction.divergent_convergent_plate_boundaries(50)To do the same, but restrict converging data to points where orthogonal converging velocities are greater than 0.2 cm/yr (with diverging data remaining unchanged with the default 0.0 threshold):
diverging_data, converging_data = plate_reconstruction.divergent_convergent_plate_boundaries(50,
        convergence_velocity_threshold=0.2)
Notes
If you want to access all sampled points regardless of their convergence/divergence you can call
topological_snapshot()and then use it to directly call pygplates.TopologicalSnapshot.calculate_plate_boundary_statistics(). Then you can do your own analysis on the returned data:plate_boundary_statistics = plate_reconstruction.topological_snapshot( time, include_topological_slab_boundaries=False ).calculate_plate_boundary_statistics( uniform_point_spacing_radians=0.001 ) for stat in plate_boundary_statistics: if np.isnan(stat.convergence_velocity_orthogonal) continue # missing left or right plate latitude, longitude = stat.boundary_point.to_lat_lon() def get_point_velocities(self, lons, lats, time, delta_time=1.0, *, velocity_delta_time_type=pygplates.pygplates.VelocityDeltaTimeType.t_plus_delta_t_to_t, velocity_units=pygplates.pygplates.VelocityUnits.kms_per_my, earth_radius_in_kms=6371.009, include_networks=True, include_topological_slab_boundaries=False, anchor_plate_id=None, return_east_north_arrays=False)-
Calculates the north and east components of the velocity vector (in kms/myr) for each specified point (from
lonsandlats) at a particular geologicaltime.Parameters
lons:array- A 1D array of point data's longitudes.
lats:array- A 1D array of point data's latitudes.
time:float- The specific geological time (Ma) at which to calculate plate velocities.
delta_time:float, default=1.0- The time interval used for velocity calculations. 1.0Ma by default.
velocity_delta_time_type:{pygplates.VelocityDeltaTimeType.t_plus_delta_t_to_t, pygplates.VelocityDeltaTimeType.t_to_t_minus_delta_t, pygplates.VelocityDeltaTimeType.t_plus_minus_half_delta_t}, default=pygplates.VelocityDeltaTimeType.t_plus_delta_t_to_t- How the two velocity times are calculated relative to
time(defaults to[time + velocity_delta_time, time]). velocity_units:{pygplates.VelocityUnits.cms_per_yr, pygplates.VelocityUnits.kms_per_my}, default=pygplates.VelocityUnits.kms_per_my- Whether to return velocities in centimetres per year or kilometres per million years (defaults to kilometres per million years).
earth_radius_in_kms:float, default=pygplates.Earth.mean_radius_in_kms- Radius of the Earth in kilometres.
This is only used to calculate velocities (strain rates always use
pygplates.Earth.equatorial_radius_in_kms). include_networks:bool, default=True- Whether to include deforming networks when calculating velocities. By default they are included (and also given precedence since they typically overlay a rigid plate).
include_topological_slab_boundaries:bool, default=False- Whether to include features of type
gpml:TopologicalSlabBoundarywhen calculating velocities. By default they are not included (they tend to overlay a rigid plate which should instead be used to calculate plate velocity). anchor_plate_id:int, optional- Anchor plate ID. Defaults to the current anchor plate ID (
anchor_plate_idattribute). return_east_north_arrays:bool, default=False- Return the velocities as arrays separately containing the east and north components of the velocities.
Note that setting this to True matches the output of
points.plate_velocity.
Returns
north_east_velocities:2D ndarray- Only provided if
return_east_north_arraysis False. Each array element contains the (north, east) velocity components of a single point. east_velocities,north_velocities:1D ndarray- Only provided if
return_east_north_arraysis True. The east and north components of velocities as separate arrays. These are also ordered (east, north) instead of (north, east).
Raises
ValueError- If topology features have not been set in this
PlateReconstruction.
Notes
The velocities are in kilometres per million years by default (not centimetres per year, the default in
Point.plate_velocity). This difference is maintained for backward compatibility.For each velocity, the north component is first followed by the east component. This is different to
Point.plate_velocitywhere the east component is first. This difference is maintained for backward compatibility. def reconstruct(self, feature, to_time, from_time=0, anchor_plate_id=None, *, reconstruct_type=pygplates.pygplates.ReconstructType.feature_geometry, group_with_feature=False)-
Reconstructs regular geological features, motion paths or flowlines to a specific geological time.
Parameters
feature:str/os.PathLike,orinstanceof<pygplates.FeatureCollection>,or<pygplates.Feature>,orsequenceof<pygplates.Feature>- The geological features to reconstruct. Can be provided as a feature collection, or filename, or feature, or sequence of features, or a sequence (eg, a list or tuple) of any combination of those four types.
to_time:float,orpygplates.GeoTimeInstant- The specific geological time to reconstruct to.
from_time:float, default=0- The specific geological time to reconstruct from. By default, this is set to present day.
If not set to 0 Ma (present day) then the geometry in
featureis assumed to be a reconstructed snapshot atfrom_time, in which case it is reverse reconstructed to present day before reconstructing toto_time. Usually features should contain present day geometry but might contain reconstructed geometry in some cases, such as those generated by the reconstruction export in GPlates. anchor_plate_id:int, optional- Anchor plate ID. Defaults to the current anchor plate ID (
anchor_plate_idattribute). reconstruct_type:pygplates.ReconstructType, default=pygplates.ReconstructType.feature_geometry- The specific reconstruction type to generate based on input feature geometry type. Can be provided as
pygplates.ReconstructType.feature_geometry to only reconstruct regular feature geometries, or
pygplates.ReconstructType.motion_path to only reconstruct motion path features, or
pygplates.ReconstructType.flowline to only reconstruct flowline features.
Generates
pygplates.ReconstructedFeatureGeometry>s, orpygplates.ReconstructedMotionPaths, orpygplates.ReconstructedFlowlines respectively. group_with_feature:bool, default=False- Used to group reconstructed geometries with their features. This can be useful when a feature has more than one
geometry and hence more than one reconstructed geometry. The returned list then becomes a list of tuples where
each tuple contains a
pygplates.Featureand alistof reconstructed geometries.
Returns
reconstructed_features:list- The reconstructed geological features.
The reconstructed geometries are output in the same order as that of their respective input features (in the
parameter
features). This includes the order across any input feature collections or files. Ifgroup_with_featureis True then the list contains tuples that group eachpygplates.Featurewith a list of its reconstructed geometries.
See Also
reconstruct_snapshot def reconstruct_snapshot(self, reconstructable_features, time, *, anchor_plate_id=None, from_time=0)-
Create a snapshot of reconstructed regular features (including motion paths and flowlines) at a specific geological time.
Parameters
reconstructable_features:str/os.PathLike,ora sequence (eg,listortuple)ofinstancesof<pygplates.Feature>,ora single instanceof<pygplates.Feature>,oran instanceof<pygplates.FeatureCollection>- Regular reconstructable features (including motion paths and flowlines). Can be provided as a feature collection, or filename, or feature, or sequence of features, or a sequence (eg, list or tuple) of any combination of those four types.
time:float,orpygplates.GeoTimeInstant- The specific geological time to reconstruct to.
anchor_plate_id:int, optional- Anchor plate ID. Defaults to the current anchor plate ID (
anchor_plate_idattribute). from_time:float, default=0- The specific geological time to reconstruct from. By default, this is set to present day.
If not set to 0 Ma (present day) then the geometry in
featureis assumed to be a reconstructed snapshot atfrom_time, in which case it is reverse reconstructed to present day before reconstructing toto_time. Usually features should contain present day geometry but might contain reconstructed geometry in some cases, such as those generated by the reconstruction export in GPlates.
Returns
reconstruct_snapshot:pygplates.ReconstructSnapshot- A pygplates.ReconstructSnapshot of the specified reconstructable features reconstructed using the internal rotation model to the specified reconstruction time.
def static_polygons_snapshot(self, time, *, anchor_plate_id=None)-
Create a reconstructed snapshot of the static polygons at the specified reconstruction time.
This returns a pygplates.ReconstructSnapshot from which you can extract reconstructed static polygons, find reconstructed polygons containing points and calculate velocities at point locations, etc.
Parameters
time:float, intorpygplates.GeoTimeInstant- The geological time at which to create the reconstructed static polygons snapshot.
anchor_plate_id:int, optional- The anchored plate id to use when reconstructing the static polygons.
If not specified then uses the current anchor plate (
anchor_plate_idattribute).
Returns
static_polygons_snapshot:pygplates.ReconstructSnapshot- The reconstructed static polygons snapshot
at the specified
time(and anchor plate).
Raises
ValueError- If static polygons have not been set in this
PlateReconstruction.
def tessellate_mid_ocean_ridges(self, time, tessellation_threshold_radians=0.001, ignore_warnings=False, return_geodataframe=False, *, use_ptt=False, spreading_feature_types=[<pygplates.pygplates.FeatureType object>], transform_segment_deviation_in_radians=1.2217304763960306, include_network_boundaries=False, divergence_threshold_in_cm_per_yr=None, output_obliquity_and_normal_and_left_right_plates=False, anchor_plate_id=None, velocity_delta_time=1.0)-
Samples points along resolved spreading features (e.g. mid-ocean ridges) and calculates spreading rates and lengths of ridge segments at a particular geological time.
Resolves topologies at
timeand tessellates all resolved spreading features into points.The transform segments of spreading features are ignored (unless
transform_segment_deviation_in_radiansisNone).Returns a 4-column vertically stacked tuple with the following data per sampled ridge point (depending on
output_obliquity_and_normal_and_left_right_plates):If
output_obliquity_and_normal_and_left_right_platesisFalse(the default):- Col. 0 - longitude of sampled ridge point
- Col. 1 - latitude of sampled ridge point
- Col. 2 - spreading velocity magnitude (in cm/yr)
- Col. 3 - length of arc segment (in degrees) that current point is on
If
output_obliquity_and_normal_and_left_right_platesisTrue:- Col. 0 - longitude of sampled ridge point
- Col. 1 - latitude of sampled ridge point
- Col. 2 - spreading velocity magnitude (in cm/yr)
- Col. 3 - spreading obliquity in degrees (deviation from normal line in range 0 to 90 degrees)
- Col. 4 - length of arc segment (in degrees) that current point is on
- Col. 5 - azimuth of vector normal to the arc segment in degrees (clockwise starting at North, ie, 0 to 360 degrees)
- Col. 6 - left plate ID
- Col. 7 - right plate ID
Parameters
time:float- The reconstruction time (Ma) at which to query spreading rates.
tessellation_threshold_radians:float, default=0.001- The threshold sampling distance along the plate boundaries (in radians).
ignore_warnings:bool, default=False- Choose to ignore warnings from Plate Tectonic Tools' ridge_spreading_rate workflow (if
use_pttisTrue). return_geodataframe:bool, default=False- Choose to return data in a geopandas.GeoDataFrame.
use_ptt:bool, default=False- If set to
Truethen uses Plate Tectonic Tools'ridge_spreading_rateworkflow to calculate ridge spreading rates (which uses the spreading stage rotation of the left/right plate IDs calculate spreading velocities). If set toFalsethen uses plate divergence to calculate ridge spreading rates (which samples velocities of the two adjacent boundary plates at each sampled point to calculate spreading velocities). Plate divergence is the more general approach that works along all plate boundaries (not just mid-ocean ridges). spreading_feature_types:<pygplates.FeatureType>orsequenceof<pygplates.FeatureType>, default=pygplates.FeatureType.gpml_mid_ocean_ridge- Only sample points along plate boundaries of the specified feature types.
Default is to only sample mid-ocean ridges.
You can explicitly specify
Noneto sample all plate boundaries, but note that ifuse_pttisTruethen only plate boundaries that are spreading feature types are sampled (since Plate Tectonic Tools only works on spreading plate boundaries, eg, mid-ocean ridges). transform_segment_deviation_in_radians:float, default=<implementation-defined>- How much a spreading direction can deviate from the segment normal before it's considered a transform segment (in radians).
The default value has been empirically determined to give the best results for typical models.
If
Nonethen the full feature geometry is used (ie, it is not split into ridge and transform segments with the transform segments getting ignored). include_network_boundaries:bool, default=False- Whether to calculate spreading rate along network boundaries that are not also plate boundaries (defaults to False). If a deforming network shares a boundary with a plate then it'll get included regardless of this option. Since spreading features occur along plate boundaries this would only be an issue if an intra-plate network boundary was incorrectly labelled as spreading.
divergence_threshold_in_cm_per_yr:float, optional- Only return sample points with an orthogonal (ie, in the spreading geometry's normal direction) diverging velocity above this value (in cm/yr).
For example, setting this to
0.0would remove all converging sample points (leaving only diverging points). This value can be negative which means a small amount of convergence is allowed. IfNonethen all (diverging and converging) sample points are returned. This is the default sincespreading_feature_typesis instead used (by default) to include only plate boundaries that are typically diverging (eg, mid-ocean ridges). However, settingspreading_feature_typestoNone(andtransform_segment_deviation_in_radianstoNone) and explicitly specifying this parameter (eg, to0.0) can be used to find points along all plate boundaries that are diverging. However, this parameter can only be specified ifuse_pttisFalse. output_obliquity_and_normal_and_left_right_plates:bool, default=False- Whether to also return spreading obliquity, normal azimuth and left/right plates.
anchor_plate_id:int, optional- Anchor plate ID. Defaults to the current anchor plate ID (
anchor_plate_idattribute).. velocity_delta_time:float, default=1.0- Velocity delta time used in spreading velocity calculations (defaults to 1 Myr).
Returns
ridge_data:a listofvertically-stacked tuples-
The results for all tessellated points sampled along the mid-ocean ridges. The size of the returned list is equal to the number of tessellated points. Each tuple in the list corresponds to a tessellated point and has the following tuple items (depending on
output_obliquity_and_normal_and_left_right_plates):If
output_obliquity_and_normal_and_left_right_platesisFalse(the default):- longitude of sampled point
- latitude of sampled point
- spreading velocity magnitude (in cm/yr)
- length of arc segment (in degrees) that sampled point is on
If
output_obliquity_and_normal_and_left_right_platesisTrue:- longitude of sampled point
- latitude of sampled point
- spreading velocity magnitude (in cm/yr)
- spreading obliquity in degrees (deviation from normal line in range 0 to 90 degrees)
- length of arc segment (in degrees) that sampled point is on
- azimuth of vector normal to the arc segment in degrees (clockwise starting at North, ie, 0 to 360 degrees)
- left plate ID
- right plate ID
Raises
ValueError- If topology features have not been set in this
PlateReconstruction. ValueError- If
use_pttisTrueanddivergence_threshold_in_cm_per_yris notNone.
Notes
If
use_pttis False then each ridge segment is sampled at exactly uniform intervals along its length such that the sampled points have a uniform spacing (along each ridge segment polyline) that is equal totessellation_threshold_radians. Ifuse_pttis True then each ridge segment is sampled at approximately uniform intervals along its length such that the sampled points have a uniform spacing (along each ridge segment polyline) that is less than or equal totessellation_threshold_radians.Examples
To sample points along mid-ocean ridges at 50Ma, but ignoring the transform segments (of the ridges):
ridge_data = plate_reconstruction.tessellate_mid_ocean_ridges(50)To do the same, but instead of ignoring transform segments include both ridge and transform segments, but only where orthogonal diverging velocities are greater than 0.2 cm/yr:
ridge_data = plate_reconstruction.tessellate_mid_ocean_ridges(50,
        transform_segment_deviation_in_radians=None,
        divergence_threshold_in_cm_per_yr=0.2)
def tessellate_subduction_zones(self, time, tessellation_threshold_radians=0.001, ignore_warnings=False, return_geodataframe=False, *, use_ptt=False, include_network_boundaries=False, convergence_threshold_in_cm_per_yr=None, anchor_plate_id=None, velocity_delta_time=1.0, output_distance_to_nearest_edge_of_trench=False, output_distance_to_start_edge_of_trench=False, output_convergence_velocity_components=False, output_trench_absolute_velocity_components=False, output_subducting_absolute_velocity=False, output_subducting_absolute_velocity_components=False, output_trench_normal=False)-
Samples points along subduction zone trenches and obtains subduction data at a particular geological time.
Resolves topologies at
timeand tessellates all resolved subducting features into points.Returns a 10-column vertically-stacked tuple with the following data per sampled trench point:
- Col. 0 - longitude of sampled trench point
- Col. 1 - latitude of sampled trench point
- Col. 2 - subducting convergence (relative to trench) velocity magnitude (in cm/yr)
- Col. 3 - subducting convergence velocity obliquity angle in degrees (angle between trench normal vector and convergence velocity vector)
- Col. 4 - trench absolute (relative to anchor plate) velocity magnitude (in cm/yr)
- Col. 5 - trench absolute velocity obliquity angle in degrees (angle between trench normal vector and trench absolute velocity vector)
- Col. 6 - length of arc segment (in degrees) that current point is on
- Col. 7 - trench normal (in subduction direction, ie, towards overriding plate) azimuth angle (clockwise starting at North, ie, 0 to 360 degrees) at current point
- Col. 8 - subducting plate ID
- Col. 9 - trench plate ID
The optional 'output_*' parameters can be used to append extra data to the output tuple of each sampled trench point. The order of any extra data is the same order in which the parameters are listed below.
Parameters
time:float- The reconstruction time (Ma) at which to query subduction convergence.
tessellation_threshold_radians:float, default=0.001- The threshold sampling distance along the plate boundaries (in radians).
ignore_warnings:bool, default=False- Choose to ignore warnings from Plate Tectonic Tools' subduction_convergence workflow (if
use_pttisTrue). return_geodataframe:bool, default=False- Choose to return data in a geopandas.GeoDataFrame.
use_ptt:bool, default=False- If set to
Truethen uses Plate Tectonic Tools'subduction_convergenceworkflow to calculate subduction convergence (which uses the subducting stage rotation of the subduction/trench plate IDs calculate subducting velocities). If set toFalsethen uses plate convergence to calculate subduction convergence (which samples velocities of the two adjacent boundary plates at each sampled point to calculate subducting velocities). Both methods ignore plate boundaries that do not have a subduction polarity (feature property), which essentially means they only sample subduction zones. include_network_boundaries:bool, default=False- Whether to calculate subduction convergence along network boundaries that are not also plate boundaries (defaults to False). If a deforming network shares a boundary with a plate then it'll get included regardless of this option. Since subduction zones occur along plate boundaries this would only be an issue if an intra-plate network boundary was incorrectly labelled as subducting.
convergence_threshold_in_cm_per_yr:float, optional- Only return sample points with an orthogonal (ie, in the subducting geometry's normal direction) converging velocity above this value (in cm/yr).
For example, setting this to
0.0would remove all diverging sample points (leaving only converging points). This value can be negative which means a small amount of divergence is allowed. IfNonethen all (converging and diverging) sample points are returned. This is the default. Note that this parameter can only be specified ifuse_pttisFalse. anchor_plate_id:int, optional- Anchor plate ID. Defaults to the current anchor plate ID (
anchor_plate_idattribute).. velocity_delta_time:float, default=1.0- Velocity delta time used in convergence velocity calculations (defaults to 1 Myr).
output_distance_to_nearest_edge_of_trench:bool, default=False- Append the distance (in degrees) along the trench line to the nearest trench edge to each returned sample point. A trench edge is the farthermost location on the current trench feature that contributes to a plate boundary.
output_distance_to_start_edge_of_trench:bool, default=False- Append the distance (in degrees) along the trench line from the start edge of the trench to each returned sample point. The start of the trench is along the clockwise direction around the overriding plate.
output_convergence_velocity_components:bool, default=False- Append the convergence velocity orthogonal and parallel components (in cm/yr) to each returned sample point. Orthogonal is normal to trench (in direction of overriding plate when positive). Parallel is along trench (90 degrees clockwise from trench normal when positive).
output_trench_absolute_velocity_components:bool, default=False- Append the trench absolute velocity orthogonal and parallel components (in cm/yr) to each returned sample point. Orthogonal is normal to trench (in direction of overriding plate when positive). Parallel is along trench (90 degrees clockwise from trench normal when positive).
output_subducting_absolute_velocity:bool, default=False- Append the subducting plate absolute velocity magnitude (in cm/yr) and obliquity angle (in degrees) to each returned sample point.
output_subducting_absolute_velocity_components:bool, default=False- Append the subducting plate absolute velocity orthogonal and parallel components (in cm/yr) to each returned sample point. Orthogonal is normal to trench (in direction of overriding plate when positive). Parallel is along trench (90 degrees clockwise from trench normal when positive).
output_trench_normal:bool, default=False- Append the x, y and z components of the trench normal unit-length 3D vectors. These vectors are normal to the trench in the direction of subduction (towards overriding plate). These are global 3D vectors which differ from trench normal azimuth angles (ie, angles relative to North).
Returns
subduction_data:a listofvertically-stacked tuples-
The results for all tessellated points sampled along the trench. The size of the returned list is equal to the number of tessellated points. Each tuple in the list corresponds to a tessellated point and has the following tuple items:
- Col. 0 - longitude of sampled trench point
- Col. 1 - latitude of sampled trench point
- Col. 2 - subducting convergence (relative to trench) velocity magnitude (in cm/yr)
- Col. 3 - subducting convergence velocity obliquity angle in degrees (angle between trench normal vector and convergence velocity vector)
- Col. 4 - trench absolute (relative to anchor plate) velocity magnitude (in cm/yr)
- Col. 5 - trench absolute velocity obliquity angle in degrees (angle between trench normal vector and trench absolute velocity vector)
- Col. 6 - length of arc segment (in degrees) that current point is on
- Col. 7 - trench normal (in subduction direction, ie, towards overriding plate) azimuth angle (clockwise starting at North, ie, 0 to 360 degrees) at current point
- Col. 8 - subducting plate ID
- Col. 9 - trench plate ID
The optional 'output_*' parameters can be used to append extra data to the tuple of each sampled trench point. The order of any extra data is the same order in which the parameters are listed in this function.
Raises
ValueError- If topology features have not been set in this
PlateReconstruction. ValueError- If
use_pttisTrueandconvergence_threshold_in_cm_per_yris notNone.
Notes
If
use_pttis False then each trench is sampled at exactly uniform intervals along its length such that the sampled points have a uniform spacing (along each trench polyline) that is equal totessellation_threshold_radians. Ifuse_pttis True then each trench is sampled at approximately uniform intervals along its length such that the sampled points have a uniform spacing (along each trench polyline) that is less than or equal totessellation_threshold_radians.The trench normal (at each sampled trench point) always points towards the overriding plate. The obliquity angles are in the range (-180, 180). The range (0, 180) goes clockwise (when viewed from above the Earth) from the trench normal direction to the velocity vector. The range (0, -180) goes counter-clockwise. You can change the range (-180, 180) to the range (0, 360) by adding 360 to negative angles. The trench normal is perpendicular to the trench and pointing toward the overriding plate.
Note that the convergence velocity magnitude is negative if the plates are diverging (if convergence obliquity angle is greater than 90 or less than -90). And note that the trench absolute velocity magnitude is negative if the trench (subduction zone) is moving towards the overriding plate (if trench absolute obliquity angle is less than 90 and greater than -90) - note that this ignores the kinematics of the subducting plate. Similiarly for the subducting plate absolute velocity magnitude (if keyword argument
output_subducting_absolute_velocityis True).The trench plate ID at each sample point can differ from the overriding plate ID. This is because, even in a non-deforming model, the smaller plates (not modelled by topologies) can move differently than the larger topological plate. So the trench line has the plate IDs of the smaller plates.
Examples
To sample points along subduction zones at 50Ma:
subduction_data = plate_reconstruction.tessellate_subduction_zones(50)To sample points along subduction zones at 50Ma, but only where there's convergence:
subduction_data = plate_reconstruction.tessellate_subduction_zones(50,
        convergence_threshold_in_cm_per_yr=0.0)
def topological_snapshot(self, time, *, anchor_plate_id=None, include_topological_slab_boundaries=True)-
Create a snapshot of resolved topologies at the specified reconstruction time.
This returns a pygplates.TopologicalSnapshot from which you can extract resolved topologies, calculate velocities at point locations, calculate plate boundary statistics, etc.
Parameters
time:float, intorpygplates.GeoTimeInstant- The geological time at which to create the topological snapshot.
anchor_plate_id:int, optional- The anchored plate id to use when resolving topologies.
If not specified then uses the current anchor plate (
anchor_plate_idattribute). include_topological_slab_boundaries:bool, default=True- Include topological boundary features of type
gpml:TopologicalSlabBoundary. By default all features passed into constructor (__init__) are included in the snapshot. However setting this to False is useful when you're only interested in plate boundaries.
Returns
topological_snapshot:pygplates.TopologicalSnapshot- The topological snapshot
at the specified
time(and anchor plate).
Raises
ValueError- If topology features have not been set in this
PlateReconstruction.
def total_continental_arc_length(self, time, continental_grid, trench_arc_distance, ignore_warnings=True, *, use_ptt=False, include_network_boundaries=False, convergence_threshold_in_cm_per_yr=None)-
Calculates the total length of all global continental arcs (km) at the specified geological time (Ma).
Resolves topologies at
timeand tessellates all resolved subducting features into points (seetessellate_subduction_zones). The resolved points then are projected out by thetrench_arc_distance(towards overriding plate) and their new locations are linearly interpolated onto the suppliedcontinental_grid. If the projected trench points lie in the grid, they are considered continental arc points, and their arc segment lengths are appended to the total continental arc length for the specifiedtime. The total length is scaled to kilometres using the geocentric radius (at each sampled point).Parameters
time:int- The geological time at which to calculate total continental arc lengths.
continental_grid:Raster, array_like,orstr- The continental grid used to identify continental arc points. Must
be convertible to
Raster. For an array, a global extent is assumed [-180,180,-90,90]. For a filename, the extent is obtained from the file. trench_arc_distance:float- The trench-to-arc distance (in kilometres) to project sampled trench points out by in the direction of the overriding plate.
ignore_warnings:bool, default=True- Choose whether to ignore warning messages from Plate Tectonic Tools' subduction_convergence workflow (if
use_pttisTrue) that alerts the user of subduction sub-segments that are ignored due to unidentified polarities and/or subducting plates. use_ptt:bool, default=False- If set to
Truethen uses Plate Tectonic Tools'subduction_convergenceworkflow to sample subducting features and their subduction polarities. If set toFalsethen uses plate convergence instead. Plate convergence is the more general approach that works along all plate boundaries (not just subduction zones). include_network_boundaries:bool, default=False- Whether to sample subducting features along network boundaries that are not also plate boundaries (defaults to False). If a deforming network shares a boundary with a plate then it'll get included regardless of this option. Since subduction zones occur along plate boundaries this would only be an issue if an intra-plate network boundary was incorrectly labelled as subducting.
convergence_threshold_in_cm_per_yr:float, optional- Only sample points with an orthogonal (ie, in the subducting geometry's normal direction) converging velocity above this value (in cm/yr).
For example, setting this to
0.0would remove all diverging sample points (leaving only converging points). This value can be negative which means a small amount of divergence is allowed. IfNonethen all (converging and diverging) points are sampled. This is the default. Note that this parameter can only be specified ifuse_pttisFalse.
Returns
total_continental_arc_length_kms:float- The continental arc length (in km) at the specified time.
Raises
ValueError- If topology features have not been set in this
PlateReconstruction. ValueError- If
use_pttisTrueandconvergence_threshold_in_cm_per_yris notNone.
Examples
To calculate the total length of continental arcs at 50Ma:
total_continental_arc_length_kms = plate_reconstruction.total_continental_arc_length(50)To calculate the total length of subduction zones adjacent to continents at 50Ma, but only where there's actual convergence:
total_continental_arc_length_kms = plate_reconstruction.total_continental_arc_length(50,
        convergence_threshold_in_cm_per_yr=0.0)
def total_ridge_length(self, time, use_ptt=False, ignore_warnings=False, *, spreading_feature_types=[<pygplates.pygplates.FeatureType object>], transform_segment_deviation_in_radians=1.2217304763960306, include_network_boundaries=False, divergence_threshold_in_cm_per_yr=None)-
Calculates the total length of all resolved spreading features (e.g. mid-ocean ridges) at the specified geological time (Ma).
Resolves topologies at
timeand tessellates all resolved spreading features into points (seetessellate_mid_ocean_ridges).The transform segments of spreading features are ignored (unless transform_segment_deviation_in_radians is
None).Total length is calculated by sampling points along the resolved spreading features (e.g. mid-ocean ridges) and accumulating their lengths (see
tessellate_mid_ocean_ridges). Scales lengths to kilometres using the geocentric radius (at each sampled point).Parameters
time:int- The geological time at which to calculate total mid-ocean ridge lengths.
use_ptt:bool, default=False- If set to
Truethen uses Plate Tectonic Tools'ridge_spreading_rateworkflow to calculate total ridge length (which uses the spreading stage rotation of the left/right plate IDs to calculate spreading directions - seetransform_segment_deviation_in_radians). If set toFalsethen uses plate divergence to calculate total ridge length (which samples velocities of the two adjacent boundary plates at each sampled point to calculate spreading directions - seetransform_segment_deviation_in_radians). Plate divergence is the more general approach that works along all plate boundaries (not just mid-ocean ridges). ignore_warnings:bool, default=False- Choose to ignore warnings from Plate Tectonic Tools' ridge_spreading_rate workflow (if
use_pttisTrue). spreading_feature_types:<pygplates.FeatureType>orsequenceof<pygplates.FeatureType>, default=pygplates.FeatureType.gpml_mid_ocean_ridge- Only count lengths along plate boundaries of the specified feature types.
Default is to only sample mid-ocean ridges.
You can explicitly specify
Noneto sample all plate boundaries, but note that ifuse_pttisTruethen only plate boundaries that are spreading feature types are sampled (since Plate Tectonic Tools only works on spreading plate boundaries, eg, mid-ocean ridges). transform_segment_deviation_in_radians:float, default=<implementation-defined>- How much a spreading direction can deviate from the segment normal before it's considered a transform segment (in radians).
The default value has been empirically determined to give the best results for typical models.
If
Nonethen the full feature geometry is used (ie, it is not split into ridge and transform segments with the transform segments getting ignored). include_network_boundaries:bool, default=False- Whether to count lengths along network boundaries that are not also plate boundaries (defaults to False). If a deforming network shares a boundary with a plate then it'll get included regardless of this option. Since spreading features occur along plate boundaries this would only be an issue if an intra-plate network boundary was incorrectly labelled as spreading.
divergence_threshold_in_cm_per_yr:float, optional- Only count lengths associated with sample points that have an orthogonal (ie, in the spreading geometry's normal direction) diverging velocity above this value (in cm/yr).
For example, setting this to
0.0would remove all converging sample points (leaving only diverging points). This value can be negative which means a small amount of convergence is allowed. IfNonethen all (diverging and converging) sample points are counted. This is the default since spreading_feature_types is instead used (by default) to include only plate boundaries that are typically diverging (eg, mid-ocean ridges). However, settingspreading_feature_typestoNone(andtransform_segment_deviation_in_radianstoNone) and explicitly specifying this parameter (eg, to0.0) can be used to count points along all plate boundaries that are diverging. However, this parameter can only be specified if use_ptt isFalse.
Returns
total_ridge_length_kms:float- The total length of global mid-ocean ridges (in kilometres) at the specified time.
Raises
ValueError- If topology features have not been set in this
PlateReconstruction. ValueError- If
use_pttisTrueanddivergence_threshold_in_cm_per_yris notNone.
Examples
To calculate the total length of mid-ocean ridges at 50Ma, but ignoring the transform segments (of the ridges):
total_ridge_length_kms = plate_reconstruction.total_ridge_length(50)To do the same, but instead of ignoring transform segments include both ridge and transform segments, but only where orthogonal diverging velocities are greater than 0.2 cm/yr:
total_ridge_length_kms = plate_reconstruction.total_ridge_length(50,
        transform_segment_deviation_in_radians=None,
        divergence_threshold_in_cm_per_yr=0.2)
def total_subduction_zone_length(self, time, use_ptt=False, ignore_warnings=False, *, include_network_boundaries=False, convergence_threshold_in_cm_per_yr=None)-
Calculates the total length of all subduction zones (km) at the specified geological time (Ma).
Resolves topologies at
timeand tessellates all resolved subducting features into points (seetessellate_subduction_zones).Total length is calculated by sampling points along the resolved subducting features (e.g. subduction zones) and accumulating their lengths (see
tessellate_subduction_zones). Scales lengths to kilometres using the geocentric radius (at each sampled point).Parameters
time:int- The geological time at which to calculate total subduction zone lengths.
use_ptt:bool, default=False- If set to
Truethen uses Plate Tectonic Tools'subduction_convergenceworkflow to calculate total subduction zone length. If set toFalsethen uses plate convergence instead. Plate convergence is the more general approach that works along all plate boundaries (not just subduction zones). ignore_warnings:bool, default=False- Choose to ignore warnings from Plate Tectonic Tools' subduction_convergence workflow (if
use_pttisTrue). include_network_boundaries:bool, default=False- Whether to count lengths along network boundaries that are not also plate boundaries (defaults to False). If a deforming network shares a boundary with a plate then it'll get included regardless of this option. Since subduction zones occur along plate boundaries this would only be an issue if an intra-plate network boundary was incorrectly labelled as subducting.
convergence_threshold_in_cm_per_yr:float, optional- Only count lengths associated with sample points that have an orthogonal (ie, in the subducting geometry's normal direction) converging velocity above this value (in cm/yr).
For example, setting this to
0.0would remove all diverging sample points (leaving only converging points). This value can be negative which means a small amount of divergence is allowed. IfNonethen all (converging and diverging) sample points are counted. This is the default. Note that this parameter can only be specified ifuse_pttisFalse.
Returns
total_subduction_zone_length_kms:float- The total subduction zone length (in km) at the specified
time.
Raises
ValueError- If topology features have not been set in this
PlateReconstruction. ValueError- If
use_pttisTrueandconvergence_threshold_in_cm_per_yris notNone.
Examples
To calculate the total length of subduction zones at 50Ma:
total_subduction_zone_length_kms = plate_reconstruction.total_subduction_zone_length(50)To calculate the total length of subduction zones at 50Ma, but only where there's actual convergence:
total_subduction_zone_length_kms = plate_reconstruction.total_subduction_zone_length(50,
        convergence_threshold_in_cm_per_yr=0.0)
class PlotTopologies (plate_reconstruction, coastlines=None, continents=None, COBs=None, time=None, anchor_plate_id=None, plot_engine: gplately.mapping.plot_engine.PlotEngine = <gplately.mapping.cartopy_plot.CartopyPlotEngine object>)-
A class with tools to read, reconstruct and plot topology features at specific reconstruction times.
PlotTopologiesis a shorthand for PyGPlates and Shapely functionalities that:- Read features held in GPlates GPML (GPlates Markup Language) files and ESRI shapefiles;
- Reconstruct the locations of these features as they migrate through geological time;
- Turn these reconstructed features into Shapely geometries for plotting
on
cartopy.mpl.geoaxes.GeoAxesorcartopy.mpl.geoaxes.GeoAxesSubplotmap Projections.
To call the
PlotTopologiesobject, supply:- an instance of the GPlately
plate_reconstructionobject
and optionally,
- a
coastline_filename - a
continent_filename - a
COB_filename - a reconstruction
time - an
anchor_plate_id
For example:
# Calling the PlotTopologies object
gplot = gplately.plot.PlotTopologies(plate_reconstruction,
                                    coastline_filename=None,
                                    continent_filename=None,
                                    COB_filename=None,
                                    time=None,
                                    anchor_plate_id=None,
        )

# Setting a new reconstruction time
gplot.time = 20 # Ma
The
coastline_filename,continent_filenameandCOB_filenamecan be single strings to GPML and/or shapefiles, as well as instances ofpygplates.FeatureCollection. If using GPlately'sDataServerobject to source these files, they will be passed aspygplates.FeatureCollectionitems.Some features for plotting (like plate boundaries) are taken from the
PlateReconstructionobject'stopology_featuresattribute. They have already been reconstructed to the giventime. Simply provide a new reconstruction time by changing thetimeattribute, e.g.gplot.time = 20 # Mawhich will automatically reconstruct all topologies to the specified time. You MUST set
gplot.timebefore plotting anything.A variety of geological features can be plotted on GeoAxes/GeoAxesSubplot maps as Shapely
MultiLineStringorMultiPolygongeometries, including:- subduction boundaries & subduction polarity teeth
- mid-ocean ridge boundaries
- transform boundaries
- miscellaneous boundaries
- coastline polylines
- continental polygons and
- continent-ocean boundary polylines
- topological plate velocity vector fields
- netCDF4 MaskedArray or ndarray raster data:
- seafloor age grids
- paleo-age grids
- global relief (topography and bathymetry)
- assorted reconstructable feature data, for example:
- seafloor fabric
- large igneous provinces
- volcanic provinces
Attributes
plate_reconstruction:instanceof<gplately.reconstruction.PlateReconstruction>- The GPlately
PlateReconstructionobject will be used to access a platerotation_modeland a set oftopology_featureswhich contains plate boundary features like trenches, ridges and transforms. anchor_plate_id:int- The anchor plate ID used for reconstruction.
Defaults to the anchor plate of
plate_reconstruction. base_projection:instanceof<cartopy.crs.{transform}>, default<cartopy.crs.PlateCarree> object- where {transform} is the map Projection to use on the Cartopy GeoAxes. By default, the base projection is set to cartopy.crs.PlateCarree. See the Cartopy projection list for all supported Projection types.
coastlines:str,orinstanceof<pygplates.FeatureCollection>- The full string path to a coastline feature file. Coastline features can also
be passed as instances of the
pygplates.FeatureCollectionobject (this is the case if these features are sourced from theDataServerobject). continents:str,orinstanceof<pygplates.FeatureCollection>- The full string path to a continent feature file. Continent features can also
be passed as instances of the
pygplates.FeatureCollectionobject (this is the case if these features are sourced from theDataServerobject). COBs:str,orinstanceof<pygplates.FeatureCollection>- The full string path to a COB feature file. COB features can also be passed
as instances of the
pygplates.FeatureCollectionobject (this is the case if these features are sourced from theDataServerobject). coastlines:iterable/listof<pygplates.ReconstructedFeatureGeometry>- A list containing coastline features reconstructed to the specified
timeattribute. continents:iterable/listof<pygplates.ReconstructedFeatureGeometry>- A list containing continent features reconstructed to the specified
timeattribute. COBs:iterable/listof<pygplates.ReconstructedFeatureGeometry>- A list containing COB features reconstructed to the specified
timeattribute. time:float- The time (Ma) to reconstruct and plot geological features to.
topologies:iterable/listof<pygplates.Feature>-
A list containing assorted topologies like:
- pygplates.FeatureType.gpml_topological_network
- pygplates.FeatureType.gpml_oceanic_crust
- pygplates.FeatureType.gpml_topological_slab_boundary
- pygplates.FeatureType.gpml_topological_closed_plate_boundary
ridges:iterable/listof<pygplates.Feature>- A list containing ridge and transform boundary sections of type pygplates.FeatureType.gpml_mid_ocean_ridge
transforms:iterable/listof<pygplates.Feature>- A list containing transform boundary sections of type pygplates.FeatureType.gpml_transforms
trenches:iterable/listof<pygplates.Feature>- A list containing trench boundary sections of type pygplates.FeatureType.gpml_subduction_zone
trench_left:iterable/listof<pygplates.Feature>- A list containing left subduction boundary sections of type pygplates.FeatureType.gpml_subduction_zone
trench_right:iterable/listof<pygplates.Feature>- A list containing right subduction boundary sections of type pygplates.FeatureType.gpml_subduction_zone
other:iterable/listof<pygplates.Feature>- A list containing other geological features like unclassified features, extended continental crusts, continental rifts, faults, orogenic belts, fracture zones, inferred paleo boundaries, terrane boundaries and passive continental boundaries.
Expand source code
class PlotTopologies(object): """A class with tools to read, reconstruct and plot topology features at specific reconstruction times. `PlotTopologies` is a shorthand for PyGPlates and Shapely functionalities that: * Read features held in GPlates GPML (GPlates Markup Language) files and ESRI shapefiles; * Reconstruct the locations of these features as they migrate through geological time; * Turn these reconstructed features into Shapely geometries for plotting on `cartopy.mpl.geoaxes.GeoAxes` or `cartopy.mpl.geoaxes.GeoAxesSubplot` map Projections. To call the `PlotTopologies` object, supply: * an instance of the GPlately `plate_reconstruction` object and optionally, * a `coastline_filename` * a `continent_filename` * a `COB_filename` * a reconstruction `time` * an `anchor_plate_id` For example: # Calling the PlotTopologies object gplot = gplately.plot.PlotTopologies(plate_reconstruction, coastline_filename=None, continent_filename=None, COB_filename=None, time=None, anchor_plate_id=None, ) # Setting a new reconstruction time gplot.time = 20 # Ma The `coastline_filename`, `continent_filename` and `COB_filename` can be single strings to GPML and/or shapefiles, as well as instances of `pygplates.FeatureCollection`. If using GPlately's `DataServer` object to source these files, they will be passed as `pygplates.FeatureCollection` items. Some features for plotting (like plate boundaries) are taken from the `PlateReconstruction` object's`topology_features` attribute. They have already been reconstructed to the given `time`. Simply provide a new reconstruction time by changing the `time` attribute, e.g. gplot.time = 20 # Ma which will automatically reconstruct all topologies to the specified time. You __MUST__ set `gplot.time` before plotting anything. A variety of geological features can be plotted on GeoAxes/GeoAxesSubplot maps as Shapely `MultiLineString` or `MultiPolygon` geometries, including: * subduction boundaries & subduction polarity teeth * mid-ocean ridge boundaries * transform boundaries * miscellaneous boundaries * coastline polylines * continental polygons and * continent-ocean boundary polylines * topological plate velocity vector fields * netCDF4 MaskedArray or ndarray raster data: - seafloor age grids - paleo-age grids - global relief (topography and bathymetry) * assorted reconstructable feature data, for example: - seafloor fabric - large igneous provinces - volcanic provinces Attributes ---------- plate_reconstruction : instance of <gplately.reconstruction.PlateReconstruction> The GPlately `PlateReconstruction` object will be used to access a plate `rotation_model` and a set of `topology_features` which contains plate boundary features like trenches, ridges and transforms. anchor_plate_id : int The anchor plate ID used for reconstruction. Defaults to the anchor plate of `plate_reconstruction`. base_projection : instance of <cartopy.crs.{transform}>, default <cartopy.crs.PlateCarree> object where {transform} is the map Projection to use on the Cartopy GeoAxes. By default, the base projection is set to cartopy.crs.PlateCarree. See the [Cartopy projection list](https://scitools.org.uk/cartopy/docs/v0.15/crs/projections.html) for all supported Projection types. coastlines : str, or instance of <pygplates.FeatureCollection> The full string path to a coastline feature file. Coastline features can also be passed as instances of the `pygplates.FeatureCollection` object (this is the case if these features are sourced from the `DataServer` object). continents : str, or instance of <pygplates.FeatureCollection> The full string path to a continent feature file. Continent features can also be passed as instances of the `pygplates.FeatureCollection` object (this is the case if these features are sourced from the `DataServer` object). COBs : str, or instance of <pygplates.FeatureCollection> The full string path to a COB feature file. COB features can also be passed as instances of the `pygplates.FeatureCollection` object (this is the case if these features are sourced from the `DataServer` object). coastlines : iterable/list of <pygplates.ReconstructedFeatureGeometry> A list containing coastline features reconstructed to the specified `time` attribute. continents : iterable/list of <pygplates.ReconstructedFeatureGeometry> A list containing continent features reconstructed to the specified `time` attribute. COBs : iterable/list of <pygplates.ReconstructedFeatureGeometry> A list containing COB features reconstructed to the specified `time` attribute. time : float The time (Ma) to reconstruct and plot geological features to. topologies : iterable/list of <pygplates.Feature> A list containing assorted topologies like: - pygplates.FeatureType.gpml_topological_network - pygplates.FeatureType.gpml_oceanic_crust - pygplates.FeatureType.gpml_topological_slab_boundary - pygplates.FeatureType.gpml_topological_closed_plate_boundary ridges : iterable/list of <pygplates.Feature> A list containing ridge and transform boundary sections of type pygplates.FeatureType.gpml_mid_ocean_ridge transforms : iterable/list of <pygplates.Feature> A list containing transform boundary sections of type pygplates.FeatureType.gpml_transforms trenches : iterable/list of <pygplates.Feature> A list containing trench boundary sections of type pygplates.FeatureType.gpml_subduction_zone trench_left : iterable/list of <pygplates.Feature> A list containing left subduction boundary sections of type pygplates.FeatureType.gpml_subduction_zone trench_right : iterable/list of <pygplates.Feature> A list containing right subduction boundary sections of type pygplates.FeatureType.gpml_subduction_zone other : iterable/list of <pygplates.Feature> A list containing other geological features like unclassified features, extended continental crusts, continental rifts, faults, orogenic belts, fracture zones, inferred paleo boundaries, terrane boundaries and passive continental boundaries. """ def __init__( self, plate_reconstruction, coastlines=None, continents=None, COBs=None, time=None, anchor_plate_id=None, plot_engine: PlotEngine = CartopyPlotEngine(), ): self._plot_engine = plot_engine self.plate_reconstruction = plate_reconstruction if self.plate_reconstruction.topology_features is None: self.plate_reconstruction.topology_features = [] logger.warning("Plate model does not have topology features.") self.base_projection = DEFAULT_CARTOPY_PROJECTION # store these for when time is updated # make sure these are initialised as FeatureCollection objects self._coastlines = _load_FeatureCollection(coastlines) self._continents = _load_FeatureCollection(continents) self._COBs = _load_FeatureCollection(COBs) self.coastlines = None self.continents = None self.COBs = None self._topological_plate_boundaries = None self._topologies = None self._ridges = [] self._transforms = [] self._plot_engine = plot_engine if anchor_plate_id is None: # Default to the anchor plate of 'self.plate_reconstruction'. self._anchor_plate_id = None else: self._anchor_plate_id = self._check_anchor_plate_id(anchor_plate_id) self._time = None if time is not None: # setting time runs the update_time routine self.time = time def __reduce__(self): # Arguments for __init__. # # Only one argument is required by __init__, and that's a PlateReconstruction object (which'll get pickled). init_args = (self.plate_reconstruction,) # State for __setstate__. state = self.__dict__.copy() # Remove 'plate_reconstruction' since that will get passed to __init__. del state["plate_reconstruction"] # Remove the unpicklable entries. # # This includes pygplates reconstructed feature geometries and resolved topological geometries. # Note: PyGPlates features and features collections (and rotation models) can be pickled though. # # __setstate__ will call 'update_time()' to generate these reconstructed/resolved geometries/features. # So we don't need to pickle them. # Note: Some of them we can pickle (eg, "resolved features", which are of type pygplates.Feature) and # some we cannot (like 'coastlines' which are of type pygplates.ReconstructedFeatureGeometry). # However, as mentioned, we won't pickle any of them (since taken care of by 'update_time()'). for key in ( "coastlines", # we're keeping "_coastlines" though (we need the original 'pygplates.Feature's to reconstruct with) "continents", # we're keeping "_continents" though (we need the original 'pygplates.Feature's to reconstruct with) "COBs", # we're keeping "_COBs" though (we need the original 'pygplates.Feature's to reconstruct with) "_topological_plate_boundaries", "_topologies", "_ridges", "_ridges_do_not_use_for_now", "_transforms", "_transforms_do_not_use_for_now", "trenches", "trench_left", "trench_right", "other", "continental_rifts", "faults", "fracture_zones", "inferred_paleo_boundaries", "terrane_boundaries", "transitional_crusts", "orogenic_belts", "sutures", "continental_crusts", "extended_continental_crusts", "passive_continental_boundaries", "slab_edges", "unclassified_features", ): if key in state: # in case some state has not been initialised yet del state[key] # Call __init__ so that we default initialise everything in a consistent state before __setstate__ gets called. # Note that this is the reason we implement __reduce__, instead of __getstate__ (where __init__ doesn't get called). # # If we don't do this then __setstate__ would need to stay in sync with __init__ (whenever it gets updated). return PlotTopologies, init_args, state def __setstate__(self, state): self.__dict__.update(state) # Restore the unpicklable entries. # # This includes pygplates reconstructed feature geometries and resolved topological geometries. # Note: PyGPlates features and features collections (and rotation models) can be pickled though. # # Re-generate the pygplates reconstructed feature geometries and resolved topological geometries # deleted from the state returned by __reduce__. if self.time is not None: self.update_time(self.time) @property def topological_plate_boundaries(self): """ Resolved topologies for rigid boundaries ONLY. """ return self._topological_plate_boundaries @property def topologies(self): """ Resolved topologies for BOTH rigid boundaries and networks. """ return self._topologies @property def ridges(self): """ Mid-ocean ridge features (all the features which are labelled as gpml:MidOceanRidge in the model). """ logger.debug( "The 'ridges' property has been changed since GPlately 1.3.0. " "You need to check your workflow to make sure the new 'ridges' property still suits your purpose. " "In earlier releases of GPlately, we used an algorithm to identify the 'ridges' and 'transforms' within the gpml:MidOceanRidge features. " "Unfortunately, the algorithm did not work very well. So we have removed the algorithm and now the 'ridges' property contains all the features " "which are labelled as gpml:MidOceanRidge in the reconstruction model." ) # use logger.debug to make the message less aggressive return self._ridges @property def transforms(self): """ Transform boundary features (all the features which are labelled as gpml:Transform in the model). """ logger.debug( "The 'transforms' property has been changed since GPlately 1.3.0. " "You need to check your workflow to make sure the new 'transforms' property still suits your purpose. " "In earlier releases of GPlately, we used an algorithm to identify the 'ridges' and 'transforms' within the gpml:MidOceanRidge features. " "Unfortunately, the algorithm did not work very well. So we have removed the algorithm and now the 'transforms' property contains all the features " "which are labelled as gpml:Transform in the reconstruction model." ) # use logger.debug to make the message less aggressive return self._transforms @property def time(self): """The reconstruction time.""" return self._time @time.setter def time(self, var): """Allows the time attribute to be changed. Updates all instances of the time attribute in the object (e.g. reconstructions and resolving topologies will use this new time). Raises ------ ValueError If the chosen reconstruction time is <0 Ma. """ if var < 0: raise ValueError("The 'time' property must be greater than 0.") if self.time is None or (not math.isclose(var, self.time)): self.update_time(var) @property def anchor_plate_id(self): """Anchor plate ID for reconstruction. Must be an integer >= 0.""" if self._anchor_plate_id is None: # Default to anchor plate of 'self.plate_reconstruction'. return self.plate_reconstruction.anchor_plate_id return self._anchor_plate_id @anchor_plate_id.setter def anchor_plate_id(self, anchor_plate): if anchor_plate is None: # We'll use the anchor plate of 'self.plate_reconstruction'. self._anchor_plate_id = None else: self._anchor_plate_id = self._check_anchor_plate_id(anchor_plate) # Reconstructed/resolved geometries depend on the anchor plate. if self.time is not None: self.update_time(self.time) @staticmethod def _check_anchor_plate_id(id): id = int(id) if id < 0: raise ValueError("Invalid anchor plate ID: {}".format(id)) return id @property def ridge_transforms(self): """ Deprecated! DO NOT USE! """ warnings.warn( "Deprecated! DO NOT USE!" "The 'ridge_transforms' property will be removed in the future GPlately releases. " "Update your workflow to use the 'ridges' and 'transforms' properties instead, " "otherwise your workflow will not work with the future GPlately releases.", DeprecationWarning, stacklevel=2, ) logger.debug( "The 'ridge_transforms' property has been changed since GPlately 1.3.0. " "You need to check your workflow to make sure the new 'ridge_transforms' property still suits your purpose. " "In earlier releases of GPlately, the 'ridge_transforms' property contains only the features " "which are labelled as gpml:MidOceanRidge in the reconstruction model. " "Now, the 'ridge_transforms' property contains both gpml:Transform and gpml:MidOceanRidge features." ) return self._ridges + self._transforms def update_time(self, time): """Re-reconstruct features and topologies to the time specified by the `PlotTopologies` `time` attribute whenever it or the anchor plate is updated. Notes ----- The following `PlotTopologies` attributes are updated whenever a reconstruction `time` attribute is set: - resolved topology features (topological plates and networks) - ridge and transform boundary sections (resolved features) - ridge boundary sections (resolved features) - transform boundary sections (resolved features) - subduction boundary sections (resolved features) - left subduction boundary sections (resolved features) - right subduction boundary sections (resolved features) - other boundary sections (resolved features) that are not subduction zones or mid-ocean ridges (ridge/transform) Moreover, coastlines, continents and COBs are reconstructed to the new specified `time`. """ assert time is not None, "time must be set to a valid reconstruction time" self._time = float(time) # Get the topological snapshot (of resolved topologies) for the current time (and our anchor plate ID). topological_snapshot = self.plate_reconstruction.topological_snapshot( self.time, # If our anchor plate is None then this will use the anchor plate of 'self.plate_reconstruction'... anchor_plate_id=self._anchor_plate_id, ) # # NOTE: If you add a new data member here that's a pygplates reconstructable feature geometry or resolved topological geometry, # then be sure to also include it in __getstate__/()__setstate__() # (basically anything reconstructed or resolved by pygplates since those cannot be pickled). # # Extract (from the topological snapshot) resolved topologies for BOTH rigid boundaries and networks. self._topologies = [ t.get_resolved_feature() for t in topological_snapshot.get_resolved_topologies( resolve_topology_types=pygplates.ResolveTopologyType.boundary | pygplates.ResolveTopologyType.network ) ] ( self._topological_plate_boundaries, self._ridges, self._ridges_do_not_use_for_now, # the algorithm to separate ridges and transforms has not been ready yet self._transforms_do_not_use_for_now, self.trenches, self.trench_left, self.trench_right, self.other, ) = ptt.resolve_topologies.resolve_topological_snapshot_into_features( topological_snapshot, # use ResolveTopologyType.boundary parameter to resolve rigid plate boundary only # because the Mid-ocean ridges(and transforms) should not contain lines from topological networks resolve_topology_types=pygplates.ResolveTopologyType.boundary, # type: ignore ) # miscellaneous boundaries self.continental_rifts = [] self.faults = [] self.fracture_zones = [] self.inferred_paleo_boundaries = [] self.terrane_boundaries = [] self.transitional_crusts = [] self.orogenic_belts = [] self.sutures = [] self.continental_crusts = [] self.extended_continental_crusts = [] self.passive_continental_boundaries = [] self.slab_edges = [] self.unclassified_features = [] self._transforms = [] for topol in self.other: if topol.get_feature_type() == pygplates.FeatureType.gpml_continental_rift: # type: ignore self.continental_rifts.append(topol) elif topol.get_feature_type() == pygplates.FeatureType.gpml_fault: # type: ignore self.faults.append(topol) elif topol.get_feature_type() == pygplates.FeatureType.gpml_fracture_zone: # type: ignore self.fracture_zones.append(topol) elif ( topol.get_feature_type() == pygplates.FeatureType.gpml_inferred_paleo_boundary # type: ignore ): self.inferred_paleo_boundaries.append(topol) elif ( topol.get_feature_type() == pygplates.FeatureType.gpml_terrane_boundary # type: ignore ): self.terrane_boundaries.append(topol) elif ( topol.get_feature_type() == pygplates.FeatureType.gpml_transitional_crust # type: ignore ): self.transitional_crusts.append(topol) elif topol.get_feature_type() == pygplates.FeatureType.gpml_orogenic_belt: # type: ignore self.orogenic_belts.append(topol) elif topol.get_feature_type() == pygplates.FeatureType.gpml_suture: # type: ignore self.sutures.append(topol) elif ( topol.get_feature_type() == pygplates.FeatureType.gpml_continental_crust # type: ignore ): self.continental_crusts.append(topol) elif ( topol.get_feature_type() == pygplates.FeatureType.gpml_extended_continental_crust # type: ignore ): self.extended_continental_crusts.append(topol) elif ( topol.get_feature_type() == pygplates.FeatureType.gpml_passive_continental_boundary # type: ignore ): self.passive_continental_boundaries.append(topol) elif topol.get_feature_type() == pygplates.FeatureType.gpml_slab_edge: # type: ignore self.slab_edges.append(topol) elif topol.get_feature_type() == pygplates.FeatureType.gpml_transform: # type: ignore self._transforms.append(topol) elif ( topol.get_feature_type() == pygplates.FeatureType.gpml_unclassified_feature # type: ignore ): self.unclassified_features.append(topol) # reconstruct other important polygons and lines if self._coastlines: self.coastlines = self.plate_reconstruction.reconstruct( self._coastlines, self.time, from_time=0, # If our anchor plate is None then this will use the anchor plate of 'self.plate_reconstruction'... anchor_plate_id=self._anchor_plate_id, ) if self._continents: self.continents = self.plate_reconstruction.reconstruct( self._continents, self.time, from_time=0, # If our anchor plate is None then this will use the anchor plate of 'self.plate_reconstruction'... anchor_plate_id=self._anchor_plate_id, ) if self._COBs: self.COBs = self.plate_reconstruction.reconstruct( self._COBs, self.time, from_time=0, # If our anchor plate is None then this will use the anchor plate of 'self.plate_reconstruction'... anchor_plate_id=self._anchor_plate_id, ) # subduction teeth def _tessellate_triangles( self, features, tesselation_radians, triangle_base_length, triangle_aspect=1.0 ): """Places subduction teeth along subduction boundary line segments within a MultiLineString shapefile. Parameters ---------- shapefilename : str Path to shapefile containing the subduction boundary features tesselation_radians : float Parametrises subduction teeth density. Triangles are generated only along line segments with distances that exceed the given threshold tessellation_radians. triangle_base_length : float Length of teeth triangle base triangle_aspect : float, default=1.0 Aspect ratio of teeth triangles. Ratio is 1.0 by default. Returns ------- X_points : (n,3) array X points that define the teeth triangles Y_points : (n,3) array Y points that define the teeth triangles """ tesselation_degrees = np.degrees(tesselation_radians) triangle_pointsX = [] triangle_pointsY = [] date_line_wrapper = pygplates.DateLineWrapper() # type: ignore for feature in features: cum_distance = 0.0 for geometry in feature.get_geometries(): wrapped_lines = date_line_wrapper.wrap(geometry) for line in wrapped_lines: pts = np.array( [ (p.get_longitude(), p.get_latitude()) for p in line.get_points() ] ) for p in range(0, len(pts) - 1): A = pts[p] B = pts[p + 1] AB_dist = B - A AB_norm = AB_dist / np.hypot(*AB_dist) cum_distance += np.hypot(*AB_dist) # create a new triangle if cumulative distance is exceeded. if cum_distance >= tesselation_degrees: C = A + triangle_base_length * AB_norm # find normal vector AD_dist = np.array([AB_norm[1], -AB_norm[0]]) AD_norm = AD_dist / np.linalg.norm(AD_dist) C0 = A + 0.5 * triangle_base_length * AB_norm # project point along normal vector D = C0 + triangle_base_length * triangle_aspect * AD_norm triangle_pointsX.append([A[0], C[0], D[0]]) triangle_pointsY.append([A[1], C[1], D[1]]) cum_distance = 0.0 return np.array(triangle_pointsX), np.array(triangle_pointsY) @validate_reconstruction_time def get_feature( self, feature, central_meridian=0.0, tessellate_degrees=None, validate_reconstruction_time=True, ): """Create a geopandas.GeoDataFrame object containing geometries of reconstructed features. Notes ----- The feature needed to produce the GeoDataFrame should already be constructed to a `time`. This function converts the feature into a set of Shapely geometries whose coordinates are passed to a geopandas GeoDataFrame. Parameters ---------- feature : instance of <pygplates.Feature> A feature reconstructed to `time`. Returns ------- gdf : instance of <geopandas.GeoDataFrame> A pandas.DataFrame that has a column with `feature` geometries. """ if feature is None: raise ValueError( "The 'feature' parameter is None. Make sure a valid `feature` object has been provided." ) shp = shapelify_features( feature, central_meridian=central_meridian, tessellate_degrees=tessellate_degrees, ) return gpd.GeoDataFrame({"geometry": shp}, geometry="geometry", crs="EPSG:4326") # type: ignore @append_docstring(PLOT_DOCSTRING.format("feature")) def plot_feature(self, ax, feature, feature_name="", color="black", **kwargs): """Plot pygplates.FeatureCollection or pygplates.Feature onto a map.""" if not feature: logger.warning( f"The given feature({feature_name}:{feature}) in model:{self.plate_reconstruction.plate_model_name} is empty and will not be plotted." ) return ax else: if "edgecolor" not in kwargs.keys(): kwargs["edgecolor"] = color if "facecolor" not in kwargs.keys(): kwargs["facecolor"] = "none" return self._plot_feature(ax, partial(self.get_feature, feature), **kwargs) def _plot_feature(self, ax, get_feature_func, **kwargs) -> None: if "transform" in kwargs.keys(): warnings.warn( "'transform' keyword argument is ignored by PlotTopologies", UserWarning, ) kwargs.pop("transform") tessellate_degrees = kwargs.pop("tessellate_degrees", 1) central_meridian = kwargs.pop("central_meridian", None) if central_meridian is None: central_meridian = _meridian_from_ax(ax) if not callable(get_feature_func): raise Exception("The 'get_feature_func' parameter must be callable.") gdf = get_feature_func( central_meridian=central_meridian, tessellate_degrees=tessellate_degrees, ) if not isinstance(gdf, gpd.GeoDataFrame): raise Exception( f"Expecting a GeoDataFrame object, but the gdf is {type(gdf)}" ) if len(gdf) == 0: logger.debug("No feature found for plotting. Do nothing and return.") return ax self._plot_engine.plot_geo_data_frame(ax, gdf, **kwargs) @validate_reconstruction_time @append_docstring(GET_DATE_DOCSTRING.format("coastlines")) def get_coastlines(self, central_meridian=0.0, tessellate_degrees=None): """Create a geopandas.GeoDataFrame object containing geometries of reconstructed coastline polygons.""" return self.get_feature( self.coastlines, central_meridian=central_meridian, tessellate_degrees=tessellate_degrees, ) @validate_reconstruction_time @append_docstring(PLOT_DOCSTRING.format("coastlines")) def plot_coastlines(self, ax, color="black", **kwargs): """Plot reconstructed coastline polygons onto a standard map Projection. Notes ----- The `coastlines` for plotting are accessed from the `PlotTopologies` object's `coastlines` attribute. These `coastlines` are reconstructed to the `time` passed to the `PlotTopologies` object and converted into Shapely polylines. The reconstructed `coastlines` are added onto the GeoAxes or GeoAxesSubplot map `ax` using GeoPandas. Map resentation details (e.g. facecolor, edgecolor, alpha…) are permitted as keyword arguments. """ return self.plot_feature( ax, self.coastlines, feature_name="coastlines", color=color, **kwargs, ) @validate_reconstruction_time @append_docstring(GET_DATE_DOCSTRING.format("continents")) def get_continents(self, central_meridian=0.0, tessellate_degrees=None): """Create a geopandas.GeoDataFrame object containing geometries of reconstructed continental polygons.""" return self.get_feature( self.continents, central_meridian=central_meridian, tessellate_degrees=tessellate_degrees, ) @validate_reconstruction_time @append_docstring(PLOT_DOCSTRING.format("continents")) def plot_continents(self, ax, color="black", **kwargs): """Plot reconstructed continental polygons onto a standard map Projection. Notes ----- The `continents` for plotting are accessed from the `PlotTopologies` object's `continents` attribute. These `continents` are reconstructed to the `time` passed to the `PlotTopologies` object and converted into Shapely polygons. The reconstructed `coastlines` are plotted onto the GeoAxes or GeoAxesSubplot map `ax` using GeoPandas. Map presentation details (e.g. facecolor, edgecolor, alpha…) are permitted as keyword arguments. """ return self.plot_feature( ax, self.continents, feature_name="continents", color=color, **kwargs, ) @validate_reconstruction_time @append_docstring(GET_DATE_DOCSTRING.format("COBs")) def get_continent_ocean_boundaries( self, central_meridian=0.0, tessellate_degrees=None, ): """Create a geopandas.GeoDataFrame object containing geometries of reconstructed continent-ocean boundary lines.""" return self.get_feature( self.COBs, central_meridian=central_meridian, tessellate_degrees=tessellate_degrees, ) @validate_reconstruction_time @append_docstring(PLOT_DOCSTRING.format("continent ocean boundaries")) def plot_continent_ocean_boundaries(self, ax, color="black", **kwargs): """Plot reconstructed continent-ocean boundary (COB) polygons onto a standard map Projection. Notes ----- The `COBs` for plotting are accessed from the `PlotTopologies` object's `COBs` attribute. These `COBs` are reconstructed to the `time` passed to the `PlotTopologies` object and converted into Shapely polylines. The reconstructed `COBs` are plotted onto the GeoAxes or GeoAxesSubplot map `ax` using GeoPandas. Map presentation details (e.g. `facecolor`, `edgecolor`, `alpha`…) are permitted as keyword arguments. These COBs are transformed into shapely geometries and added onto the chosen map for a specific geological time (supplied to the PlotTopologies object). Map presentation details (e.g. facecolor, edgecolor, alpha…) are permitted. """ return self.plot_feature( ax, self.COBs, feature_name="continent_ocean_boundaries", color=color, **kwargs, ) @validate_reconstruction_time @append_docstring(GET_DATE_DOCSTRING.format("ridges")) def get_ridges( self, central_meridian=0.0, tessellate_degrees=1, ): """Create a geopandas.GeoDataFrame object containing the geometries of reconstructed mid-ocean ridge lines (gpml:MidOceanRidge).""" logger.debug( "The 'get_ridges' function has been changed since GPlately 1.3.0. " "You need to check your workflow to make sure the new 'get_ridges' function still suits your purpose. " "In earlier releases of GPlately, we used an algorithm to identify the 'ridges' and 'transforms' within the gpml:MidOceanRidge features. " "Unfortunately, the algorithm did not work very well. So we have removed the algorithm and now the 'get_ridges' function returns all the features " "which are labelled as gpml:MidOceanRidge in the reconstruction model." ) # use logger.debug to make the message less aggressive return self.get_feature( self.ridges, central_meridian=central_meridian, tessellate_degrees=tessellate_degrees, ) @validate_reconstruction_time @validate_topology_availability("ridges") @append_docstring(PLOT_DOCSTRING.format("ridges")) def plot_ridges(self, ax, color="black", **kwargs): """Plot reconstructed mid-ocean ridge lines(gpml:MidOceanRidge) onto a map. Notes ----- The `ridges` sections for plotting are accessed from the `PlotTopologies` object's `ridges` attribute. These `ridges` are reconstructed to the `time` passed to the `PlotTopologies` object and converted into Shapely polylines. The reconstructed `ridges` are plotted onto the GeoAxes or GeoAxesSubplot map `ax` using GeoPandas. Map presentation details (e.g. `facecolor`, `edgecolor`, `alpha`…) are permitted as keyword arguments. Note: The `ridges` geometries are wrapped to the dateline using pyGPlates' [DateLineWrapper](https://www.gplates.org/docs/pygplates/generated/pygplates.datelinewrapper) by splitting a polyline into multiple polylines at the dateline. This is to avoid horizontal lines being formed between polylines at longitudes of -180 and 180 degrees. Point features near the poles (-89 & 89 degree latitude) are also clipped to ensure compatibility with Cartopy. """ logger.debug( "The 'plot_ridges' function has been changed since GPlately 1.3.0. " "You need to check your workflow to make sure the new 'plot_ridges' function still suits your purpose. " "In earlier releases of GPlately, we used an algorithm to identify the 'ridges' and 'transforms' within the gpml:MidOceanRidge features. " "Unfortunately, the algorithm did not work very well. So we have removed the algorithm and now the 'plot_ridges' function plots all the features " "which are labelled as gpml:MidOceanRidge in the reconstruction model." ) # use logger.debug to make the message less aggressive return self.plot_feature( ax, self._ridges, feature_name="ridges", facecolor="none", edgecolor=color, **kwargs, ) @validate_reconstruction_time @append_docstring(GET_DATE_DOCSTRING.format("trenches")) def get_trenches(self, central_meridian=0.0, tessellate_degrees=1): """Create a geopandas.GeoDataFrame object containing geometries of reconstructed trench lines.""" return self.get_feature( self.trenches, central_meridian=central_meridian, tessellate_degrees=tessellate_degrees, ) @validate_reconstruction_time def get_ridges_and_transforms(self, central_meridian=0.0, tessellate_degrees=1): """ Deprecated! DO NOT USE. """ warnings.warn( "Deprecated! The 'get_ridges_and_transforms' function will be removed in the future GPlately releases. " "Update your workflow to use the 'get_ridges' and 'get_transforms' functions instead, " "otherwise your workflow will not work with the future GPlately releases.", DeprecationWarning, stacklevel=2, ) logger.debug( "The 'get_ridges_and_transforms' function has been changed since GPlately 1.3.0. " "You need to check your workflow to make sure the new 'get_ridges_and_transforms' function still suits your purpose. " "In earlier releases of GPlately, we used an algorithm to identify the 'ridges' and 'transforms' within the gpml:MidOceanRidge features. " "Unfortunately, the algorithm did not work very well. So we have removed the algorithm and now the 'get_ridges_and_transforms' function returns all the features " "which are labelled as gpml:MidOceanRidge or gpml:Transform in the reconstruction model." ) # use logger.debug to make the message less aggressive return self.get_feature( self._ridges + self._transforms, central_meridian=central_meridian, tessellate_degrees=tessellate_degrees, ) @validate_topology_availability("trenches") @append_docstring(PLOT_DOCSTRING.format("trenches")) def plot_trenches(self, ax, color="black", **kwargs): """Plot reconstructed subduction trench polylines onto a standard map Projection. Notes ----- The trench sections for plotting are accessed from the `PlotTopologies` object's `trenches` attribute. These `trenches` are reconstructed to the `time` passed to the `PlotTopologies` object and converted into Shapely polylines. The reconstructed `trenches` are plotted onto the GeoAxes or GeoAxesSubplot map `ax` using GeoPandas. Map presentation details (e.g. `facecolor`, `edgecolor`, `alpha`…) are permitted as keyword arguments. Trench geometries are wrapped to the dateline using pyGPlates' [DateLineWrapper](https://www.gplates.org/docs/pygplates/generated/pygplates.datelinewrapper) by splitting a polyline into multiple polylines at the dateline. This is to avoid horizontal lines being formed between polylines at longitudes of -180 and 180 degrees. Point features near the poles (-89 & 89 degree latitude) are also clipped to ensure compatibility with Cartopy. """ return self.plot_feature( ax, self.trenches, feature_name="trenches", facecolor="none", edgecolor=color, **kwargs, ) @validate_reconstruction_time @append_docstring(GET_DATE_DOCSTRING.format("other")) def get_misc_boundaries(self, central_meridian=0.0, tessellate_degrees=1): """Create a geopandas.GeoDataFrame object containing geometries of other reconstructed lines.""" return self.get_feature( self.other, central_meridian=central_meridian, tessellate_degrees=tessellate_degrees, ) @validate_reconstruction_time @append_docstring(PLOT_DOCSTRING.format("other")) def plot_misc_boundaries(self, ax, color="black", **kwargs): """Plot reconstructed miscellaneous plate boundary polylines onto a standard map Projection. Notes ----- The miscellaneous boundary sections for plotting are accessed from the `PlotTopologies` object's `other` attribute. These `other` boundaries are reconstructed to the `time` passed to the `PlotTopologies` object and converted into Shapely polylines. The reconstructed `other` boundaries are plotted onto the GeoAxes or GeoAxesSubplot map `ax` using GeoPandas. Map presentation details (e.g. `facecolor`, `edgecolor`, `alpha`…) are permitted as keyword arguments. Miscellaneous boundary geometries are wrapped to the dateline using pyGPlates' [DateLineWrapper](https://www.gplates.org/docs/pygplates/generated/pygplates.datelinewrapper) by splitting a polyline into multiple polylines at the dateline. This is to avoid horizontal lines being formed between polylines at longitudes of -180 and 180 degrees. Point features near the poles (-89 & 89 degree latitude) are also clipped to ensure compatibility with Cartopy. """ return self.plot_feature( ax, self.other, feature_name="misc_boundaries", facecolor="none", edgecolor=color, **kwargs, ) def plot_subduction_teeth_deprecated( self, ax, spacing=0.1, size=2.0, aspect=1, color="black", **kwargs ): """Plot subduction teeth onto a standard map Projection. Notes ----- Subduction teeth are tessellated from `PlotTopologies` object attributes `trench_left` and `trench_right`, and transformed into Shapely polygons for plotting. Parameters ---------- ax : instance of <cartopy.mpl.geoaxes.GeoAxes> or <cartopy.mpl.geoaxes.GeoAxesSubplot> A subclass of `matplotlib.axes.Axes` which represents a map Projection. The map should be set at a particular Cartopy projection. spacing : float, default=0.1 The tessellation threshold (in radians). Parametrises subduction tooth density. Triangles are generated only along line segments with distances that exceed the given threshold ‘spacing’. size : float, default=2.0 Length of teeth triangle base. aspect : float, default=1 Aspect ratio of teeth triangles. Ratio is 1.0 by default. color : str, default=’black’ The colour of the teeth. By default, it is set to black. **kwargs : Keyword arguments for parameters such as ‘alpha’, etc. for plotting subduction tooth polygons. See `Matplotlib` keyword arguments [here](https://matplotlib.org/stable/api/_as_gen/matplotlib.pyplot.plot.html). Returns ------- ax : instance of <geopandas.GeoDataFrame.plot> A standard cartopy.mpl.geoaxes.GeoAxes or cartopy.mpl.geoaxes.GeoAxesSubplot map with subduction teeth plotted onto the chosen map projection. """ import shapely # add Subduction Teeth subd_xL, subd_yL = self._tessellate_triangles( self.trench_left, tesselation_radians=spacing, triangle_base_length=size, triangle_aspect=-aspect, ) subd_xR, subd_yR = self._tessellate_triangles( self.trench_right, tesselation_radians=spacing, triangle_base_length=size, triangle_aspect=aspect, ) teeth = [] for tX, tY in zip(subd_xL, subd_yL): triangle_xy_points = np.c_[tX, tY] shp = shapely.geometry.Polygon(triangle_xy_points) teeth.append(shp) for tX, tY in zip(subd_xR, subd_yR): triangle_xy_points = np.c_[tX, tY] shp = shapely.geometry.Polygon(triangle_xy_points) teeth.append(shp) return ax.add_geometries(teeth, crs=self.base_projection, color=color, **kwargs) @validate_reconstruction_time def get_subduction_direction(self, central_meridian=0.0, tessellate_degrees=None): """Create a geopandas.GeoDataFrame object containing geometries of trench directions. Notes ----- The `trench_left` and `trench_right` geometries needed to produce the GeoDataFrame are automatically constructed if the optional `time` parameter is passed to the `PlotTopologies` object before calling this function. `time` can be passed either when `PlotTopologies` is first called... gplot = gplately.PlotTopologies(..., time=100,...) or anytime afterwards, by setting: time = 100 #Ma gplot.time = time ...after which this function can be re-run. Once the `other` geometries are reconstructed, they are converted into Shapely features whose coordinates are passed to a geopandas GeoDataFrame. Returns ------- gdf_left : instance of <geopandas.GeoDataFrame> A pandas.DataFrame that has a column with `trench_left` geometry. gdf_right : instance of <geopandas.GeoDataFrame> A pandas.DataFrame that has a column with `trench_right` geometry. Raises ------ ValueError If the optional `time` parameter has not been passed to `PlotTopologies`. This is needed to construct `trench_left` or `trench_right` geometries to the requested `time` and thus populate the GeoDataFrame. """ if self.trench_left is None or self.trench_right is None: raise Exception( "No subduction zone/trench data is found. Make sure the plate model has topology feature." ) trench_left_features = shapelify_feature_lines( self.trench_left, tessellate_degrees=tessellate_degrees, central_meridian=central_meridian, ) trench_right_features = shapelify_feature_lines( self.trench_right, tessellate_degrees=tessellate_degrees, central_meridian=central_meridian, ) gdf_left = gpd.GeoDataFrame( {"geometry": trench_left_features}, geometry="geometry", crs="EPSG:4326" ) # type: ignore gdf_right = gpd.GeoDataFrame( {"geometry": trench_right_features}, geometry="geometry", crs="EPSG:4326" ) # type: ignore return gdf_left, gdf_right @validate_reconstruction_time @validate_topology_availability("Subduction Zones") def plot_subduction_teeth( self, ax, spacing=0.07, size=None, aspect=None, color="black", **kwargs ) -> None: """Plot subduction teeth onto a standard map Projection. Notes ----- Subduction teeth are tessellated from `PlotTopologies` object attributes `trench_left` and `trench_right`, and transformed into Shapely polygons for plotting. Parameters ---------- ax : instance of <cartopy.mpl.geoaxes.GeoAxes> or <cartopy.mpl.geoaxes.GeoAxesSubplot> A subclass of `matplotlib.axes.Axes` which represents a map Projection. The map should be set at a particular Cartopy projection. spacing : float, default=0.07 The tessellation threshold (in radians). Parametrises subduction tooth density. Triangles are generated only along line segments with distances that exceed the given threshold `spacing`. size : float, default=None Length of teeth triangle base (in radians). If kept at `None`, then `size = 0.5*spacing`. aspect : float, default=None Aspect ratio of teeth triangles. If kept at `None`, then `aspect = 2/3*size`. color : str, default='black' The colour of the teeth. By default, it is set to black. **kwargs : Keyword arguments parameters such as `alpha`, etc. for plotting subduction tooth polygons. See `Matplotlib` keyword arguments [here](https://matplotlib.org/stable/api/_as_gen/matplotlib.pyplot.plot.html). """ kwargs["spacing"] = spacing kwargs["size"] = size kwargs["aspect"] = aspect central_meridian = _meridian_from_ax(ax) tessellate_degrees = np.rad2deg(spacing) gdf_subduction_left, gdf_subduction_right = self.get_subduction_direction( tessellate_degrees=tessellate_degrees, central_meridian=central_meridian ) self._plot_engine.plot_subduction_zones( ax, gdf_subduction_left, gdf_subduction_right, color=color, **kwargs ) def plot_plate_polygon_by_id(self, ax, plate_id, color="black", **kwargs): """Plot a plate polygon with an associated `plate_id` onto a standard map Projection. Parameters ---------- ax : instance of <cartopy.mpl.geoaxes.GeoAxes> or <cartopy.mpl.geoaxes.GeoAxesSubplot> A subclass of `matplotlib.axes.Axes` which represents a map Projection. The map should be set at a particular Cartopy projection. plate_id : int A plate ID that identifies the continental polygon to plot. See the [Global EarthByte plate IDs list](https://www.earthbyte.org/webdav/ftp/earthbyte/GPlates/SampleData/FeatureCollections/Rotations/Global_EarthByte_PlateIDs_20071218.pdf) for a full list of plate IDs to plot. **kwargs : Keyword arguments for map presentation parameters such as `alpha`, etc. for plotting the grid. See `Matplotlib`'s `imshow` keyword arguments [here](https://matplotlib.org/3.5.1/api/_as_gen/matplotlib.axes.Axes.imshow.html). """ features = [] if self.topologies: features = ( [ feature for feature in self.topologies if feature.get_reconstruction_plate_id() == plate_id ], ) self.plot_feature( ax, features, color=color, **kwargs, ) def plot_plate_id(self, *args, **kwargs): """TODO: remove this function The function name plot_plate_id() is bad and should be changed. The new name is plot_plate_polygon_by_id(). For backward compatibility, we allow users to use the old name in their legcy code for now. No new code should call this function. """ logger.warning( "The class method plot_plate_id is deprecated and will be removed in the future soon. Use plot_plate_polygon_by_id instead." ) return self.plot_plate_polygon_by_id(*args, **kwargs) def plot_grid(self, ax, grid, extent=[-180, 180, -90, 90], **kwargs): """Plot a `MaskedArray` raster or grid onto a standard map Projection. Notes ----- Uses Matplotlib's `imshow` [function](https://matplotlib.org/3.5.1/api/_as_gen/matplotlib.axes.Axes.imshow.html). Parameters ---------- ax : instance of <cartopy.mpl.geoaxes.GeoAxes> or <cartopy.mpl.geoaxes.GeoAxesSubplot> A subclass of `matplotlib.axes.Axes` which represents a map Projection. The map should be set at a particular Cartopy projection. grid : MaskedArray or `gplately.grids.Raster` A `MaskedArray` with elements that define a grid. The number of rows in the raster corresponds to the number of latitudinal coordinates, while the number of raster columns corresponds to the number of longitudinal coordinates. extent : 1d array, default=[-180,180,-90,90] A four-element array to specify the [min lon, max lon, min lat, max lat] with which to constrain the grid image. If no extents are supplied, full global extent is assumed. **kwargs : Keyword arguments for map presentation parameters such as `alpha`, etc. for plotting the grid. See `Matplotlib`'s `imshow` keyword arguments [here](https://matplotlib.org/3.5.1/api/_as_gen/matplotlib.axes.Axes.imshow.html). Returns ------- ax : instance of <geopandas.GeoDataFrame.plot> A standard cartopy.mpl.geoaxes.GeoAxes or cartopy.mpl.geoaxes.GeoAxesSubplot map with the grid plotted onto the chosen map projection. """ if not isinstance(self._plot_engine, CartopyPlotEngine): raise NotImplementedError( f"Plotting grid has not been implemented for {self._plot_engine.__class__} yet." ) # Override matplotlib default origin ('upper') origin = kwargs.pop("origin", "lower") from .grids import Raster if isinstance(grid, Raster): # extract extent and origin extent = grid.extent origin = grid.origin data = grid.data else: data = grid return ax.imshow( data, extent=extent, transform=self.base_projection, origin=origin, **kwargs, ) def plot_grid_from_netCDF(self, ax, filename, **kwargs): """Read a raster from a netCDF file, convert it to a `MaskedArray` and plot it onto a standard map Projection. Notes ----- `plot_grid_from_netCDF` uses Matplotlib's `imshow` [function](https://matplotlib.org/3.5.1/api/_as_gen/matplotlib.axes.Axes.imshow.html). Parameters ---------- ax : instance of <cartopy.mpl.geoaxes.GeoAxes> or <cartopy.mpl.geoaxes.GeoAxesSubplot> A subclass of `matplotlib.axes.Axes` which represents a map Projection. The map should be set at a particular Cartopy projection. filename : str Full path to a netCDF filename. **kwargs : Keyword arguments for map presentation parameters for plotting the grid. See `Matplotlib`'s `imshow` keyword arguments [here](https://matplotlib.org/3.5.1/api/_as_gen/matplotlib.axes.Axes.imshow.html). Returns ------- ax : instance of <geopandas.GeoDataFrame.plot> A standard cartopy.mpl.geoaxes.GeoAxes or cartopy.mpl.geoaxes.GeoAxesSubplot map with the netCDF grid plotted onto the chosen map projection. """ # Override matplotlib default origin ('upper') origin = kwargs.pop("origin", "lower") from .grids import read_netcdf_grid raster, lon_coords, lat_coords = read_netcdf_grid(filename, return_grids=True) extent = [lon_coords[0], lon_coords[-1], lat_coords[0], lat_coords[-1]] if lon_coords[0] < lat_coords[-1]: origin = "lower" else: origin = "upper" return self.plot_grid(ax, raster, extent=extent, origin=origin, **kwargs) def plot_plate_motion_vectors( self, ax, spacingX=10, spacingY=10, normalise=False, **kwargs ): """Calculate plate motion velocity vector fields at a particular geological time and plot them onto a standard map Projection. Notes ----- `plot_plate_motion_vectors` generates a MeshNode domain of point features using given spacings in the X and Y directions (`spacingX` and `spacingY`). Each point in the domain is assigned a plate ID, and these IDs are used to obtain equivalent stage rotations of identified tectonic plates over a 5 Ma time interval. Each point and its stage rotation are used to calculate plate velocities at a particular geological time. Velocities for each domain point are represented in the north-east-down coordinate system and plotted on a GeoAxes. Vector fields can be optionally normalised by setting `normalise` to `True`. This makes vector arrow lengths uniform. Parameters ---------- ax : instance of <cartopy.mpl.geoaxes.GeoAxes> or <cartopy.mpl.geoaxes.GeoAxesSubplot> A subclass of `matplotlib.axes.Axes` which represents a map Projection. The map should be set at a particular Cartopy projection. spacingX : int, default=10 The spacing in the X direction used to make the velocity domain point feature mesh. spacingY : int, default=10 The spacing in the Y direction used to make the velocity domain point feature mesh. normalise : bool, default=False Choose whether to normalise the velocity magnitudes so that vector lengths are all equal. **kwargs : Keyword arguments for quiver presentation parameters for plotting the velocity vector field. See `Matplotlib` quiver keyword arguments [here](https://matplotlib.org/3.5.1/api/_as_gen/matplotlib.axes.Axes.quiver.html). Returns ------- ax : instance of <geopandas.GeoDataFrame.plot> A standard cartopy.mpl.geoaxes.GeoAxes or cartopy.mpl.geoaxes.GeoAxesSubplot map with the velocity vector field plotted onto the chosen map projection. """ if not isinstance(self._plot_engine, CartopyPlotEngine): raise NotImplementedError( f"Plotting velocities has not been implemented for {self._plot_engine.__class__} yet." ) lonq, latq = np.meshgrid( np.arange(-180, 180 + spacingX, spacingX), np.arange(-90, 90 + spacingY, spacingY), ) lons = lonq.ravel() lats = latq.ravel() delta_time = 5.0 velocity_lons, velocity_lats = self.plate_reconstruction.get_point_velocities( lons, lats, self.time, delta_time=delta_time, # Match previous implementation that used ptt.velocity_tools.get_plate_velocities()... velocity_units=pygplates.VelocityUnits.kms_per_my, return_east_north_arrays=True, ) if normalise: mag = np.hypot(velocity_lons, velocity_lats) mag[mag == 0] = 1 velocity_lons /= mag velocity_lats /= mag with warnings.catch_warnings(): warnings.simplefilter("ignore", UserWarning) quiver = ax.quiver( lons, lats, velocity_lons, velocity_lats, transform=self.base_projection, **kwargs, ) return quiver def plot_pole(self, ax, lon, lat, a95, **kwargs): """ Plot pole onto a matplotlib axes. Parameters ---------- ax : instance of <cartopy.mpl.geoaxes.GeoAxes> or <cartopy.mpl.geoaxes.GeoAxesSubplot> A subclass of `matplotlib.axes.Axes` which represents a map Projection. The map should be set at a particular Cartopy projection. lon : float Longitudinal coordinate to place pole lat : float Latitudinal coordinate to place pole a95 : float The size of the pole (in degrees) Returns ------- matplotlib.patches.Circle handle """ from matplotlib import patches as mpatches # Define the projection used to display the circle: proj1 = ccrs.Orthographic(central_longitude=lon, central_latitude=lat) def compute_radius(ortho, radius_degrees): phi1 = lat + radius_degrees if lat <= 0 else lat - radius_degrees _, y1 = ortho.transform_point(lon, phi1, ccrs.PlateCarree()) return abs(y1) r_ortho = compute_radius(proj1, a95) # adding a patch patch = ax.add_patch( mpatches.Circle(xy=(lon, lat), radius=r_ortho, transform=proj1, **kwargs) ) return patch @validate_reconstruction_time @append_docstring(GET_DATE_DOCSTRING.format("continental rifts")) def get_continental_rifts( self, central_meridian=0.0, tessellate_degrees=None, ): """Create a geopandas.GeoDataFrame object containing geometries of reconstructed contiental rift lines.""" return self.get_feature( self.continental_rifts, central_meridian=central_meridian, tessellate_degrees=tessellate_degrees, ) @validate_reconstruction_time @append_docstring(PLOT_DOCSTRING.format("continental rifts")) def plot_continental_rifts(self, ax, color="black", **kwargs): """Plot continental rifts on a standard map projection.""" return self.plot_feature( ax, self.continental_rifts, feature_name="continental_rifts", facecolor="none", edgecolor=color, **kwargs, ) @validate_reconstruction_time @append_docstring(GET_DATE_DOCSTRING.format("faults")) def get_faults(self, central_meridian=0.0, tessellate_degrees=None): """Create a geopandas.GeoDataFrame object containing geometries of reconstructed fault lines.""" return self.get_feature( self.faults, central_meridian=central_meridian, tessellate_degrees=tessellate_degrees, ) @validate_reconstruction_time @append_docstring(PLOT_DOCSTRING.format("faults")) def plot_faults(self, ax, color="black", **kwargs): """Plot faults on a standard map projection.""" return self.plot_feature( ax, self.faults, feature_name="faults", facecolor="none", edgecolor=color, **kwargs, ) @validate_reconstruction_time @append_docstring(GET_DATE_DOCSTRING.format("fracture zones")) def get_fracture_zones(self, central_meridian=0.0, tessellate_degrees=None): """Create a geopandas.GeoDataFrame object containing geometries of reconstructed fracture zone lines.""" return self.get_feature( self.fracture_zones, central_meridian=central_meridian, tessellate_degrees=tessellate_degrees, ) @validate_reconstruction_time @append_docstring(PLOT_DOCSTRING.format("fracturezones")) def plot_fracture_zones(self, ax, color="black", **kwargs): """Plot fracture zones on a standard map projection.""" return self.plot_feature( ax, self.fracture_zones, feature_name="fracture_zones", facecolor="none", edgecolor=color, **kwargs, ) @validate_reconstruction_time @append_docstring(GET_DATE_DOCSTRING.format("inferred paleo-boundaries")) def get_inferred_paleo_boundaries( self, central_meridian=0.0, tessellate_degrees=None, ): """Create a geopandas.GeoDataFrame object containing geometries of reconstructed inferred paleo boundary lines.""" return self.get_feature( self.inferred_paleo_boundaries, central_meridian=central_meridian, tessellate_degrees=tessellate_degrees, ) @validate_reconstruction_time @append_docstring(PLOT_DOCSTRING.format("inferred paleo-boundaries")) def plot_inferred_paleo_boundaries(self, ax, color="black", **kwargs): """Plot inferred paleo boundaries on a standard map projection.""" return self.plot_feature( ax, self.inferred_paleo_boundaries, feature_name="inferred_paleo_boundaries", facecolor="none", edgecolor=color, **kwargs, ) @validate_reconstruction_time @append_docstring(GET_DATE_DOCSTRING.format("terrane boundaries")) def get_terrane_boundaries( self, central_meridian=0.0, tessellate_degrees=None, ): """Create a geopandas.GeoDataFrame object containing geometries of reconstructed terrane boundary lines.""" return self.get_feature( self.terrane_boundaries, central_meridian=central_meridian, tessellate_degrees=tessellate_degrees, ) @validate_reconstruction_time @append_docstring(PLOT_DOCSTRING.format("terrane boundaries")) def plot_terrane_boundaries(self, ax, color="black", **kwargs): """Plot terrane boundaries on a standard map projection.""" return self.plot_feature( ax, self.terrane_boundaries, feature_name="terrane_boundaries", facecolor="none", edgecolor=color, **kwargs, ) @validate_reconstruction_time @append_docstring(GET_DATE_DOCSTRING.format("transitional crusts")) def get_transitional_crusts( self, central_meridian=0.0, tessellate_degrees=None, ): """Create a geopandas.GeoDataFrame object containing geometries of reconstructed transitional crust lines.""" return self.get_feature( self.transitional_crusts, central_meridian=central_meridian, tessellate_degrees=tessellate_degrees, ) @validate_reconstruction_time @append_docstring(PLOT_DOCSTRING.format("transitional crusts")) def plot_transitional_crusts(self, ax, color="black", **kwargs): """Plot transitional crust on a standard map projection.""" return self.plot_feature( ax, self.transitional_crusts, feature_name="transitional_crusts", facecolor="none", edgecolor=color, **kwargs, ) @validate_reconstruction_time @append_docstring(GET_DATE_DOCSTRING.format("orogenic belts")) def get_orogenic_belts( self, central_meridian=0.0, tessellate_degrees=None, ): """Create a geopandas.GeoDataFrame object containing geometries of reconstructed orogenic belt lines.""" return self.get_feature( self.orogenic_belts, central_meridian=central_meridian, tessellate_degrees=tessellate_degrees, ) @validate_reconstruction_time @append_docstring(PLOT_DOCSTRING.format("orogenic belts")) def plot_orogenic_belts(self, ax, color="black", **kwargs): """Plot orogenic belts on a standard map projection.""" return self.plot_feature( ax, self.orogenic_belts, feature_name="orogenic_belts", facecolor="none", edgecolor=color, **kwargs, ) @validate_reconstruction_time @append_docstring(GET_DATE_DOCSTRING.format("sutures")) def get_sutures(self, central_meridian=0.0, tessellate_degrees=None): """Create a geopandas.GeoDataFrame object containing geometries of reconstructed suture lines.""" return self.get_feature( self.sutures, central_meridian=central_meridian, tessellate_degrees=tessellate_degrees, ) @validate_reconstruction_time @append_docstring(PLOT_DOCSTRING.format("sutures")) def plot_sutures(self, ax, color="black", **kwargs): """Plot sutures on a standard map projection.""" return self.plot_feature( ax, self.sutures, feature_name="sutures", facecolor="none", edgecolor=color, **kwargs, ) @validate_reconstruction_time @append_docstring(GET_DATE_DOCSTRING.format("continental crusts")) def get_continental_crusts( self, central_meridian=0.0, tessellate_degrees=None, ): """Create a geopandas.GeoDataFrame object containing geometries of reconstructed continental crust lines.""" return self.get_feature( self.continental_crusts, central_meridian=central_meridian, tessellate_degrees=tessellate_degrees, ) @validate_reconstruction_time @append_docstring(PLOT_DOCSTRING.format("continental crusts")) def plot_continental_crusts(self, ax, color="black", **kwargs): """Plot continental crust lines on a standard map projection.""" return self.plot_feature( ax, self.continental_crusts, feature_name="continental_crusts", facecolor="none", edgecolor=color, **kwargs, ) @validate_reconstruction_time @append_docstring(GET_DATE_DOCSTRING.format("extended continental crusts")) def get_extended_continental_crusts( self, central_meridian=0.0, tessellate_degrees=None, ): """Create a geopandas.GeoDataFrame object containing geometries of reconstructed extended continental crust lines.""" return self.get_feature( self.extended_continental_crusts, central_meridian=central_meridian, tessellate_degrees=tessellate_degrees, ) @validate_reconstruction_time @append_docstring(PLOT_DOCSTRING.format("extended continental crusts")) def plot_extended_continental_crusts(self, ax, color="black", **kwargs): """Plot extended continental crust lines on a standard map projection.""" return self.plot_feature( ax, self.extended_continental_crusts, feature_name="extended_continental_crusts", facecolor="none", edgecolor=color, **kwargs, ) @validate_reconstruction_time @append_docstring(GET_DATE_DOCSTRING.format("passive continental boundaries")) def get_passive_continental_boundaries( self, central_meridian=0.0, tessellate_degrees=None, ): """Create a geopandas.GeoDataFrame object containing geometries of reconstructed passive continental boundary lines.""" return self.get_feature( self.passive_continental_boundaries, central_meridian=central_meridian, tessellate_degrees=tessellate_degrees, ) @validate_reconstruction_time @append_docstring(PLOT_DOCSTRING.format("passive continental boundaries")) def plot_passive_continental_boundaries(self, ax, color="black", **kwargs): """Plot passive continental boundaries on a standard map projection.""" return self.plot_feature( ax, self.passive_continental_boundaries, feature_name="passive_continental_boundaries", facecolor="none", edgecolor=color, **kwargs, ) @validate_reconstruction_time @append_docstring(GET_DATE_DOCSTRING.format("slab edges")) def get_slab_edges(self, central_meridian=0.0, tessellate_degrees=None): """Create a geopandas.GeoDataFrame object containing geometries of reconstructed slab edge lines.""" return self.get_feature( self.slab_edges, central_meridian=central_meridian, tessellate_degrees=tessellate_degrees, ) @validate_reconstruction_time @append_docstring(PLOT_DOCSTRING.format("slab edges")) def plot_slab_edges(self, ax, color="black", **kwargs): """Plot slab edges on a standard map projection.""" return self.plot_feature( ax, self.slab_edges, feature_name="slab_edges", facecolor="none", edgecolor=color, **kwargs, ) @validate_reconstruction_time @append_docstring(GET_DATE_DOCSTRING.format("transforms")) def get_transforms( self, central_meridian=0.0, tessellate_degrees=None, ): """Create a geopandas.GeoDataFrame object containing geometries of reconstructed transform lines(gpml:Transform).""" logger.debug( "The 'get_transforms' function has been changed since GPlately 1.3.0. " "You need to check your workflow to make sure the new 'get_transforms' function still suits your purpose. " "In earlier releases of GPlately, we used an algorithm to identify the 'ridges' and 'transforms' within the gpml:MidOceanRidge features. " "Unfortunately, the algorithm did not work very well. So we have removed the algorithm and now the 'get_transforms' function returns all the features " "which are labelled as gpml:Transform in the reconstruction model." ) # use logger.debug to make the message less aggressive return self.get_feature( self._transforms, central_meridian=central_meridian, tessellate_degrees=tessellate_degrees, ) @validate_reconstruction_time @append_docstring(PLOT_DOCSTRING.format("transforms")) def plot_transforms(self, ax, color="black", **kwargs): """Plot transform boundaries(gpml:Transform) onto a map.""" logger.debug( "The 'plot_transforms' function has been changed since GPlately 1.3.0. " "You need to check your workflow to make sure the new 'plot_transforms' function still suits your purpose. " "In earlier releases of GPlately, we used an algorithm to identify the 'ridges' and 'transforms' within the gpml:MidOceanRidge features. " "Unfortunately, the algorithm did not work very well. So we have removed the algorithm and now the 'plot_transforms' function plots all the features " "which are labelled as gpml:Transform in the reconstruction model." ) # use logger.debug to make the message less aggressive return self.plot_feature( ax, self._transforms, feature_name="transforms", edgecolor=color, **kwargs, ) def plot_ridges_and_transforms(self, ax, color="black", **kwargs): """ Deprecated! DO NOT USE! """ warnings.warn( "Deprecated! The 'plot_ridges_and_transforms' function will be removed in the future GPlately releases. " "Update your workflow to use the 'plot_ridges' and 'plot_transforms' functions instead, " "otherwise your workflow will not work with the future GPlately releases.", DeprecationWarning, stacklevel=2, ) logger.debug( "The 'plot_ridges_and_transforms' function has been changed since GPlately 1.3.0. " "You need to check your workflow to make sure the new 'plot_ridges_and_transforms' function still suits your purpose. " "In earlier releases of GPlately, we used an algorithm to identify the 'ridges' and 'transforms' within the gpml:MidOceanRidge features. " "Unfortunately, the algorithm did not work very well. So we have removed the algorithm and now the 'plot_ridges_and_transforms' function plots all the features " "which are labelled as gpml:Transform or gpml:MidOceanRidge in the reconstruction model." ) # use logger.debug to make the message less aggressive self.plot_ridges(ax, color=color, **kwargs) self.plot_transforms(ax, color=color, **kwargs) @validate_reconstruction_time @append_docstring(GET_DATE_DOCSTRING.format("unclassified features")) def get_unclassified_features( self, central_meridian=0.0, tessellate_degrees=None, ): """Create a geopandas.GeoDataFrame object containing geometries of reconstructed unclassified feature lines.""" return self.get_feature( self.unclassified_features, central_meridian=central_meridian, tessellate_degrees=tessellate_degrees, ) @validate_reconstruction_time @append_docstring(PLOT_DOCSTRING.format("unclassified features")) def plot_unclassified_features(self, ax, color="black", **kwargs): """Plot GPML unclassified features on a standard map projection.""" return self.plot_feature( ax, self.unclassified_features, feature_name="unclassified_features", facecolor="none", edgecolor=color, **kwargs, ) @validate_reconstruction_time @append_docstring(GET_DATE_DOCSTRING.format("topologies")) def get_all_topologies( self, central_meridian=0.0, tessellate_degrees=1, ): """Create a geopandas.GeoDataFrame object containing geometries of reconstructed unclassified feature lines.""" # get plate IDs and feature types to add to geodataframe plate_IDs = [] feature_types = [] feature_names = [] all_topologies = [] if self.topologies: all_topologies = shapelify_features( self.topologies, central_meridian=central_meridian, tessellate_degrees=tessellate_degrees, ) for topo in self.topologies: ft_type = topo.get_feature_type() plate_IDs.append(topo.get_reconstruction_plate_id()) feature_types.append(ft_type) feature_names.append(ft_type.get_name()) gdf = gpd.GeoDataFrame( { "geometry": all_topologies, "reconstruction_plate_ID": plate_IDs, "feature_type": feature_types, "feature_name": feature_names, }, geometry="geometry", crs="EPSG:4326", ) # type: ignore return gdf @validate_topology_availability("all topologies") @append_docstring(PLOT_DOCSTRING.format("topologies")) def plot_all_topologies(self, ax, color="black", **kwargs): """Plot topological polygons and networks on a standard map projection.""" if "edgecolor" not in kwargs.keys(): kwargs["edgecolor"] = color if "facecolor" not in kwargs.keys(): kwargs["facecolor"] = "none" return self._plot_feature( ax, self.get_all_topologies, **kwargs, ) @validate_reconstruction_time @append_docstring(GET_DATE_DOCSTRING.format("topologies")) def get_all_topological_sections( self, central_meridian=0.0, tessellate_degrees=1, ): """Create a geopandas.GeoDataFrame object containing geometries of resolved topological sections.""" # get plate IDs and feature types to add to geodataframe geometries = [] plate_IDs = [] feature_types = [] feature_names = [] for topo in [ *self.ridges, *self.trenches, *self.trench_left, *self.trench_right, *self.other, ]: converted = shapelify_features( topo, central_meridian=central_meridian, tessellate_degrees=tessellate_degrees, ) if not isinstance(converted, BaseGeometry): if len(converted) > 1: tmp = [] for i in converted: if isinstance(i, BaseMultipartGeometry): tmp.extend(list(i.geoms)) else: tmp.append(i) converted = tmp del tmp converted = linemerge(converted) elif len(converted) == 1: converted = converted[0] else: continue geometries.append(converted) plate_IDs.append(topo.get_reconstruction_plate_id()) feature_types.append(topo.get_feature_type()) feature_names.append(topo.get_name()) gdf = gpd.GeoDataFrame( { "geometry": geometries, "reconstruction_plate_ID": plate_IDs, "feature_type": feature_types, "feature_name": feature_names, }, geometry="geometry", crs="EPSG:4326", ) # type: ignore return gdf @validate_topology_availability("all topological sections") @append_docstring(PLOT_DOCSTRING.format("topologies")) def plot_all_topological_sections(self, ax, color="black", **kwargs): """Plot all topologies on a standard map projection.""" return self._plot_feature( ax, self.get_all_topological_sections, color=color, **kwargs, ) @validate_reconstruction_time @append_docstring(GET_DATE_DOCSTRING.format("topological plate boundaries")) def get_topological_plate_boundaries( self, central_meridian=0.0, tessellate_degrees=1 ): """Create a geopandas.GeoDataFrame object containing geometries of reconstructed rigid topological plate boundaries.""" return self.get_feature( self._topological_plate_boundaries, central_meridian=central_meridian, tessellate_degrees=tessellate_degrees, ) @validate_topology_availability("topological plate boundaries") @append_docstring(PLOT_DOCSTRING.format("topological plate boundaries")) def plot_topological_plate_boundaries(self, ax, color="black", **kwargs): return self.plot_feature( ax, self._topological_plate_boundaries, feature_name="topological plate boundaries", color=color, **kwargs, ) @property def misc_transforms(self): """ Deprecated! DO NOT USE. """ warnings.warn( "Deprecated! The 'misc_transforms' property will be removed in the future GPlately releases. " "Update your workflow to use the 'transforms' property instead, " "otherwise your workflow will not work with the future GPlately releases.", DeprecationWarning, stacklevel=2, ) return self._transforms def plot_misc_transforms(self, ax, color="black", **kwargs): """ Deprecated! DO NOT USE. """ warnings.warn( "Deprecated! The 'plot_misc_transforms' function will be removed in the future GPlately releases. " "Update your workflow to use the 'plot_transforms' function instead, " "otherwise your workflow will not work with the future GPlately releases.", DeprecationWarning, stacklevel=2, ) self.plot_transforms(ax=ax, color=color, **kwargs) def get_misc_transforms( self, central_meridian=0.0, tessellate_degrees=None, ): """ Deprecated! DO NOT USE. """ warnings.warn( "Deprecated! The 'get_misc_transforms' function will be removed in the future GPlately releases. " "Update your workflow to use the 'get_transforms' function instead, " "otherwise your workflow will not work with the future GPlately releases.", DeprecationWarning, stacklevel=2, ) return self.get_transforms( central_meridian=central_meridian, tessellate_degrees=tessellate_degrees )Instance variables
prop anchor_plate_id-
Anchor plate ID for reconstruction. Must be an integer >= 0.
Expand source code
@property
def anchor_plate_id(self):
    """Anchor plate ID for reconstruction. Must be an integer >= 0."""
    if self._anchor_plate_id is None:
        # Default to anchor plate of 'self.plate_reconstruction'.
        return self.plate_reconstruction.anchor_plate_id

    return self._anchor_plate_id
prop misc_transforms-
Deprecated! DO NOT USE.
Expand source code
@property
def misc_transforms(self):
    """
    Deprecated! DO NOT USE.
    """
    warnings.warn(
        "Deprecated! The 'misc_transforms' property will be removed in the future GPlately releases. "
        "Update your workflow to use the 'transforms' property instead, "
        "otherwise your workflow will not work with the future GPlately releases.",
        DeprecationWarning,
        stacklevel=2,
    )
    return self._transforms
prop ridge_transforms-
Deprecated! DO NOT USE!
Expand source code
@property
def ridge_transforms(self):
    """
    Deprecated! DO NOT USE!
    """

    warnings.warn(
        "Deprecated! DO NOT USE!"
        "The 'ridge_transforms' property will be removed in the future GPlately releases. "
        "Update your workflow to use the 'ridges' and 'transforms' properties instead, "
        "otherwise your workflow will not work with the future GPlately releases.",
        DeprecationWarning,
        stacklevel=2,
    )
    logger.debug(
        "The 'ridge_transforms' property has been changed since GPlately 1.3.0. "
        "You need to check your workflow to make sure the new 'ridge_transforms' property still suits your purpose. "
        "In earlier releases of GPlately, the 'ridge_transforms' property contains only the features "
        "which are labelled as gpml:MidOceanRidge in the reconstruction model. "
        "Now, the 'ridge_transforms' property contains both gpml:Transform and gpml:MidOceanRidge features."
    )
    return self._ridges + self._transforms
prop ridges-
Mid-ocean ridge features (all the features which are labelled as gpml:MidOceanRidge in the model).
Expand source code
@property
def ridges(self):
    """
    Mid-ocean ridge features (all the features which are labelled as gpml:MidOceanRidge in the model).
    """
    logger.debug(
        "The 'ridges' property has been changed since GPlately 1.3.0. "
        "You need to check your workflow to make sure the new 'ridges' property still suits your purpose. "
        "In earlier releases of GPlately, we used an algorithm to identify the 'ridges' and 'transforms' within the gpml:MidOceanRidge features. "
        "Unfortunately, the algorithm did not work very well. So we have removed the algorithm and now the 'ridges' property contains all the features "
        "which are labelled as gpml:MidOceanRidge in the reconstruction model."
    )  # use logger.debug to make the message less aggressive
    return self._ridges
prop time-
The reconstruction time.
Expand source code
@property
def time(self):
    """The reconstruction time."""
    return self._time
prop topological_plate_boundaries-
Resolved topologies for rigid boundaries ONLY.
Expand source code
@property
def topological_plate_boundaries(self):
    """
    Resolved topologies for rigid boundaries ONLY.
    """
    return self._topological_plate_boundaries
prop topologies-
Resolved topologies for BOTH rigid boundaries and networks.
Expand source code
@property
def topologies(self):
    """
    Resolved topologies for BOTH rigid boundaries and networks.
    """
    return self._topologies
prop transforms-
Transform boundary features (all the features which are labelled as gpml:Transform in the model).
Expand source code
@property
def transforms(self):
    """
    Transform boundary features (all the features which are labelled as gpml:Transform in the model).
    """
    logger.debug(
        "The 'transforms' property has been changed since GPlately 1.3.0. "
        "You need to check your workflow to make sure the new 'transforms' property still suits your purpose. "
        "In earlier releases of GPlately, we used an algorithm to identify the 'ridges' and 'transforms' within the gpml:MidOceanRidge features. "
        "Unfortunately, the algorithm did not work very well. So we have removed the algorithm and now the 'transforms' property contains all the features "
        "which are labelled as gpml:Transform in the reconstruction model."
    )  # use logger.debug to make the message less aggressive
    return self._transforms
Methods
def get_all_topological_sections(self, central_meridian=0.0, tessellate_degrees=1)-
Create a geopandas.GeoDataFrame object containing geometries of resolved topological sections.
Parameters
central_meridian:float- Central meridian around which to perform wrapping; default: 0.0.
tessellate_degrees:floatorNone- If provided, geometries will be tessellated to this resolution prior to wrapping.
Returns
geopandas.GeoDataFrame- A pandas.DataFrame that has a column with
topologiesgeometry.
Raises
ValueError- If the optional
timeparameter has not been passed toPlotTopologies. This is needed to constructtopologiesto the requestedtimeand thus populate the GeoDataFrame.
Notes
The
topologiesneeded to produce the GeoDataFrame are automatically constructed if the optionaltimeparameter is passed to thePlotTopologiesobject before calling this function.timecan be passed either whenPlotTopologiesis first called…gplot = gplately.PlotTopologies(..., time=100,...)or anytime afterwards, by setting:
time = 100 # Ma
gplot.time = time
…after which this function can be re-run. Once the
topologiesare reconstructed, they are converted into Shapely lines whose coordinates are passed to a geopandas GeoDataFrame. def get_all_topologies(self, central_meridian=0.0, tessellate_degrees=1)-
Create a geopandas.GeoDataFrame object containing geometries of reconstructed unclassified feature lines.
Parameters
central_meridian:float- Central meridian around which to perform wrapping; default: 0.0.
tessellate_degrees:floatorNone- If provided, geometries will be tessellated to this resolution prior to wrapping.
Returns
geopandas.GeoDataFrame- A pandas.DataFrame that has a column with
topologiesgeometry.
Raises
ValueError- If the optional
timeparameter has not been passed toPlotTopologies. This is needed to constructtopologiesto the requestedtimeand thus populate the GeoDataFrame.
Notes
The
topologiesneeded to produce the GeoDataFrame are automatically constructed if the optionaltimeparameter is passed to thePlotTopologiesobject before calling this function.timecan be passed either whenPlotTopologiesis first called…gplot = gplately.PlotTopologies(..., time=100,...)or anytime afterwards, by setting:
time = 100 # Ma
gplot.time = time
…after which this function can be re-run. Once the
topologiesare reconstructed, they are converted into Shapely lines whose coordinates are passed to a geopandas GeoDataFrame. def get_coastlines(self, central_meridian=0.0, tessellate_degrees=None)-
Create a geopandas.GeoDataFrame object containing geometries of reconstructed coastline polygons.
Parameters
central_meridian:float- Central meridian around which to perform wrapping; default: 0.0.
tessellate_degrees:floatorNone- If provided, geometries will be tessellated to this resolution prior to wrapping.
Returns
geopandas.GeoDataFrame- A pandas.DataFrame that has a column with
coastlinesgeometry.
Raises
ValueError- If the optional
timeparameter has not been passed toPlotTopologies. This is needed to constructcoastlinesto the requestedtimeand thus populate the GeoDataFrame.
Notes
The
coastlinesneeded to produce the GeoDataFrame are automatically constructed if the optionaltimeparameter is passed to thePlotTopologiesobject before calling this function.timecan be passed either whenPlotTopologiesis first called…gplot = gplately.PlotTopologies(..., time=100,...)or anytime afterwards, by setting:
time = 100 # Ma
gplot.time = time
…after which this function can be re-run. Once the
coastlinesare reconstructed, they are converted into Shapely lines whose coordinates are passed to a geopandas GeoDataFrame. def get_continent_ocean_boundaries(self, central_meridian=0.0, tessellate_degrees=None)-
Create a geopandas.GeoDataFrame object containing geometries of reconstructed continent-ocean boundary lines.
Parameters
central_meridian:float- Central meridian around which to perform wrapping; default: 0.0.
tessellate_degrees:floatorNone- If provided, geometries will be tessellated to this resolution prior to wrapping.
Returns
geopandas.GeoDataFrame- A pandas.DataFrame that has a column with
COBsgeometry.
Raises
ValueError- If the optional
timeparameter has not been passed toPlotTopologies. This is needed to constructCOBsto the requestedtimeand thus populate the GeoDataFrame.
Notes
The
COBsneeded to produce the GeoDataFrame are automatically constructed if the optionaltimeparameter is passed to thePlotTopologiesobject before calling this function.timecan be passed either whenPlotTopologiesis first called…gplot = gplately.PlotTopologies(..., time=100,...)or anytime afterwards, by setting:
time = 100 # Ma
gplot.time = time
…after which this function can be re-run. Once the
COBsare reconstructed, they are converted into Shapely lines whose coordinates are passed to a geopandas GeoDataFrame. def get_continental_crusts(self, central_meridian=0.0, tessellate_degrees=None)-
Create a geopandas.GeoDataFrame object containing geometries of reconstructed continental crust lines.
Parameters
central_meridian:float- Central meridian around which to perform wrapping; default: 0.0.
tessellate_degrees:floatorNone- If provided, geometries will be tessellated to this resolution prior to wrapping.
Returns
geopandas.GeoDataFrame- A pandas.DataFrame that has a column with
continental crustsgeometry.
Raises
ValueError- If the optional
timeparameter has not been passed toPlotTopologies. This is needed to constructcontinental cruststo the requestedtimeand thus populate the GeoDataFrame.
Notes
The
continental crustsneeded to produce the GeoDataFrame are automatically constructed if the optionaltimeparameter is passed to thePlotTopologiesobject before calling this function.timecan be passed either whenPlotTopologiesis first called…gplot = gplately.PlotTopologies(..., time=100,...)or anytime afterwards, by setting:
time = 100 # Ma
gplot.time = time
…after which this function can be re-run. Once the
continental crustsare reconstructed, they are converted into Shapely lines whose coordinates are passed to a geopandas GeoDataFrame. def get_continental_rifts(self, central_meridian=0.0, tessellate_degrees=None)-
Create a geopandas.GeoDataFrame object containing geometries of reconstructed contiental rift lines.
Parameters
central_meridian:float- Central meridian around which to perform wrapping; default: 0.0.
tessellate_degrees:floatorNone- If provided, geometries will be tessellated to this resolution prior to wrapping.
Returns
geopandas.GeoDataFrame- A pandas.DataFrame that has a column with
continental riftsgeometry.
Raises
ValueError- If the optional
timeparameter has not been passed toPlotTopologies. This is needed to constructcontinental riftsto the requestedtimeand thus populate the GeoDataFrame.
Notes
The
continental riftsneeded to produce the GeoDataFrame are automatically constructed if the optionaltimeparameter is passed to thePlotTopologiesobject before calling this function.timecan be passed either whenPlotTopologiesis first called…gplot = gplately.PlotTopologies(..., time=100,...)or anytime afterwards, by setting:
time = 100 # Ma
gplot.time = time
…after which this function can be re-run. Once the
continental riftsare reconstructed, they are converted into Shapely lines whose coordinates are passed to a geopandas GeoDataFrame. def get_continents(self, central_meridian=0.0, tessellate_degrees=None)-
Create a geopandas.GeoDataFrame object containing geometries of reconstructed continental polygons.
Parameters
central_meridian:float- Central meridian around which to perform wrapping; default: 0.0.
tessellate_degrees:floatorNone- If provided, geometries will be tessellated to this resolution prior to wrapping.
Returns
geopandas.GeoDataFrame- A pandas.DataFrame that has a column with
continentsgeometry.
Raises
ValueError- If the optional
timeparameter has not been passed toPlotTopologies. This is needed to constructcontinentsto the requestedtimeand thus populate the GeoDataFrame.
Notes
The
continentsneeded to produce the GeoDataFrame are automatically constructed if the optionaltimeparameter is passed to thePlotTopologiesobject before calling this function.timecan be passed either whenPlotTopologiesis first called…gplot = gplately.PlotTopologies(..., time=100,...)or anytime afterwards, by setting:
time = 100 # Ma
gplot.time = time
…after which this function can be re-run. Once the
continentsare reconstructed, they are converted into Shapely lines whose coordinates are passed to a geopandas GeoDataFrame. def get_extended_continental_crusts(self, central_meridian=0.0, tessellate_degrees=None)-
Create a geopandas.GeoDataFrame object containing geometries of reconstructed extended continental crust lines.
Parameters
central_meridian:float- Central meridian around which to perform wrapping; default: 0.0.
tessellate_degrees:floatorNone- If provided, geometries will be tessellated to this resolution prior to wrapping.
Returns
geopandas.GeoDataFrame- A pandas.DataFrame that has a column with
extended continental crustsgeometry.
Raises
ValueError- If the optional
timeparameter has not been passed toPlotTopologies. This is needed to constructextended continental cruststo the requestedtimeand thus populate the GeoDataFrame.
Notes
The
extended continental crustsneeded to produce the GeoDataFrame are automatically constructed if the optionaltimeparameter is passed to thePlotTopologiesobject before calling this function.timecan be passed either whenPlotTopologiesis first called…gplot = gplately.PlotTopologies(..., time=100,...)or anytime afterwards, by setting:
time = 100 # Ma
gplot.time = time
…after which this function can be re-run. Once the
extended continental crustsare reconstructed, they are converted into Shapely lines whose coordinates are passed to a geopandas GeoDataFrame. def get_faults(self, central_meridian=0.0, tessellate_degrees=None)-
Create a geopandas.GeoDataFrame object containing geometries of reconstructed fault lines.
Parameters
central_meridian:float- Central meridian around which to perform wrapping; default: 0.0.
tessellate_degrees:floatorNone- If provided, geometries will be tessellated to this resolution prior to wrapping.
Returns
geopandas.GeoDataFrame- A pandas.DataFrame that has a column with
faultsgeometry.
Raises
ValueError- If the optional
timeparameter has not been passed toPlotTopologies. This is needed to constructfaultsto the requestedtimeand thus populate the GeoDataFrame.
Notes
The
faultsneeded to produce the GeoDataFrame are automatically constructed if the optionaltimeparameter is passed to thePlotTopologiesobject before calling this function.timecan be passed either whenPlotTopologiesis first called…gplot = gplately.PlotTopologies(..., time=100,...)or anytime afterwards, by setting:
time = 100 # Ma
gplot.time = time
…after which this function can be re-run. Once the
faultsare reconstructed, they are converted into Shapely lines whose coordinates are passed to a geopandas GeoDataFrame. def get_feature(self, feature, central_meridian=0.0, tessellate_degrees=None, validate_reconstruction_time=True)-
Create a geopandas.GeoDataFrame object containing geometries of reconstructed features.
Notes
The feature needed to produce the GeoDataFrame should already be constructed to a
time. This function converts the feature into a set of Shapely geometries whose coordinates are passed to a geopandas GeoDataFrame.Parameters
feature:instanceof<pygplates.Feature>- A feature reconstructed to
time.
Returns
gdf:instanceof<geopandas.GeoDataFrame>- A pandas.DataFrame that has a column with
featuregeometries.
def get_fracture_zones(self, central_meridian=0.0, tessellate_degrees=None)-
Create a geopandas.GeoDataFrame object containing geometries of reconstructed fracture zone lines.
Parameters
central_meridian:float- Central meridian around which to perform wrapping; default: 0.0.
tessellate_degrees:floatorNone- If provided, geometries will be tessellated to this resolution prior to wrapping.
Returns
geopandas.GeoDataFrame- A pandas.DataFrame that has a column with
fracture zonesgeometry.
Raises
ValueError- If the optional
timeparameter has not been passed toPlotTopologies. This is needed to constructfracture zonesto the requestedtimeand thus populate the GeoDataFrame.
Notes
The
fracture zonesneeded to produce the GeoDataFrame are automatically constructed if the optionaltimeparameter is passed to thePlotTopologiesobject before calling this function.timecan be passed either whenPlotTopologiesis first called…gplot = gplately.PlotTopologies(..., time=100,...)or anytime afterwards, by setting:
time = 100 # Ma
gplot.time = time
…after which this function can be re-run. Once the
fracture zonesare reconstructed, they are converted into Shapely lines whose coordinates are passed to a geopandas GeoDataFrame. def get_inferred_paleo_boundaries(self, central_meridian=0.0, tessellate_degrees=None)-
Create a geopandas.GeoDataFrame object containing geometries of reconstructed inferred paleo boundary lines.
Parameters
central_meridian:float- Central meridian around which to perform wrapping; default: 0.0.
tessellate_degrees:floatorNone- If provided, geometries will be tessellated to this resolution prior to wrapping.
Returns
geopandas.GeoDataFrame- A pandas.DataFrame that has a column with
inferred paleo-boundariesgeometry.
Raises
ValueError- If the optional
timeparameter has not been passed toPlotTopologies. This is needed to constructinferred paleo-boundariesto the requestedtimeand thus populate the GeoDataFrame.
Notes
The
inferred paleo-boundariesneeded to produce the GeoDataFrame are automatically constructed if the optionaltimeparameter is passed to thePlotTopologiesobject before calling this function.timecan be passed either whenPlotTopologiesis first called…gplot = gplately.PlotTopologies(..., time=100,...)or anytime afterwards, by setting:
time = 100 # Ma
gplot.time = time
…after which this function can be re-run. Once the
inferred paleo-boundariesare reconstructed, they are converted into Shapely lines whose coordinates are passed to a geopandas GeoDataFrame. def get_misc_boundaries(self, central_meridian=0.0, tessellate_degrees=1)-
Create a geopandas.GeoDataFrame object containing geometries of other reconstructed lines.
Parameters
central_meridian:float- Central meridian around which to perform wrapping; default: 0.0.
tessellate_degrees:floatorNone- If provided, geometries will be tessellated to this resolution prior to wrapping.
Returns
geopandas.GeoDataFrame- A pandas.DataFrame that has a column with
othergeometry.
Raises
ValueError- If the optional
timeparameter has not been passed toPlotTopologies. This is needed to constructotherto the requestedtimeand thus populate the GeoDataFrame.
Notes
The
otherneeded to produce the GeoDataFrame are automatically constructed if the optionaltimeparameter is passed to thePlotTopologiesobject before calling this function.timecan be passed either whenPlotTopologiesis first called…gplot = gplately.PlotTopologies(..., time=100,...)or anytime afterwards, by setting:
time = 100 # Ma
gplot.time = time
…after which this function can be re-run. Once the
otherare reconstructed, they are converted into Shapely lines whose coordinates are passed to a geopandas GeoDataFrame. def get_misc_transforms(self, central_meridian=0.0, tessellate_degrees=None)-
Deprecated! DO NOT USE.
def get_orogenic_belts(self, central_meridian=0.0, tessellate_degrees=None)-
Create a geopandas.GeoDataFrame object containing geometries of reconstructed orogenic belt lines.
Parameters
central_meridian:float- Central meridian around which to perform wrapping; default: 0.0.
tessellate_degrees:floatorNone- If provided, geometries will be tessellated to this resolution prior to wrapping.
Returns
geopandas.GeoDataFrame- A pandas.DataFrame that has a column with
orogenic beltsgeometry.
Raises
ValueError- If the optional
timeparameter has not been passed toPlotTopologies. This is needed to constructorogenic beltsto the requestedtimeand thus populate the GeoDataFrame.
Notes
The
orogenic beltsneeded to produce the GeoDataFrame are automatically constructed if the optionaltimeparameter is passed to thePlotTopologiesobject before calling this function.timecan be passed either whenPlotTopologiesis first called…gplot = gplately.PlotTopologies(..., time=100,...)or anytime afterwards, by setting:
time = 100 # Ma
gplot.time = time
…after which this function can be re-run. Once the
orogenic beltsare reconstructed, they are converted into Shapely lines whose coordinates are passed to a geopandas GeoDataFrame. def get_passive_continental_boundaries(self, central_meridian=0.0, tessellate_degrees=None)-
Create a geopandas.GeoDataFrame object containing geometries of reconstructed passive continental boundary lines.
Parameters
central_meridian:float- Central meridian around which to perform wrapping; default: 0.0.
tessellate_degrees:floatorNone- If provided, geometries will be tessellated to this resolution prior to wrapping.
Returns
geopandas.GeoDataFrame- A pandas.DataFrame that has a column with
passive continental boundariesgeometry.
Raises
ValueError- If the optional
timeparameter has not been passed toPlotTopologies. This is needed to constructpassive continental boundariesto the requestedtimeand thus populate the GeoDataFrame.
Notes
The
passive continental boundariesneeded to produce the GeoDataFrame are automatically constructed if the optionaltimeparameter is passed to thePlotTopologiesobject before calling this function.timecan be passed either whenPlotTopologiesis first called…gplot = gplately.PlotTopologies(..., time=100,...)or anytime afterwards, by setting:
time = 100 # Ma
gplot.time = time
…after which this function can be re-run. Once the
passive continental boundariesare reconstructed, they are converted into Shapely lines whose coordinates are passed to a geopandas GeoDataFrame. def get_ridges(self, central_meridian=0.0, tessellate_degrees=1)-
Create a geopandas.GeoDataFrame object containing the geometries of reconstructed mid-ocean ridge lines (gpml:MidOceanRidge).
Parameters
central_meridian:float- Central meridian around which to perform wrapping; default: 0.0.
tessellate_degrees:floatorNone- If provided, geometries will be tessellated to this resolution prior to wrapping.
Returns
geopandas.GeoDataFrame- A pandas.DataFrame that has a column with
ridgesgeometry.
Raises
ValueError- If the optional
timeparameter has not been passed toPlotTopologies. This is needed to constructridgesto the requestedtimeand thus populate the GeoDataFrame.
Notes
The
ridgesneeded to produce the GeoDataFrame are automatically constructed if the optionaltimeparameter is passed to thePlotTopologiesobject before calling this function.timecan be passed either whenPlotTopologiesis first called…gplot = gplately.PlotTopologies(..., time=100,...)or anytime afterwards, by setting:
time = 100 # Ma
gplot.time = time
…after which this function can be re-run. Once the
ridgesare reconstructed, they are converted into Shapely lines whose coordinates are passed to a geopandas GeoDataFrame. def get_ridges_and_transforms(self, central_meridian=0.0, tessellate_degrees=1)-
Deprecated! DO NOT USE.
def get_slab_edges(self, central_meridian=0.0, tessellate_degrees=None)-
Create a geopandas.GeoDataFrame object containing geometries of reconstructed slab edge lines.
Parameters
central_meridian:float- Central meridian around which to perform wrapping; default: 0.0.
tessellate_degrees:floatorNone- If provided, geometries will be tessellated to this resolution prior to wrapping.
Returns
geopandas.GeoDataFrame- A pandas.DataFrame that has a column with
slab edgesgeometry.
Raises
ValueError- If the optional
timeparameter has not been passed toPlotTopologies. This is needed to constructslab edgesto the requestedtimeand thus populate the GeoDataFrame.
Notes
The
slab edgesneeded to produce the GeoDataFrame are automatically constructed if the optionaltimeparameter is passed to thePlotTopologiesobject before calling this function.timecan be passed either whenPlotTopologiesis first called…gplot = gplately.PlotTopologies(..., time=100,...)or anytime afterwards, by setting:
time = 100 # Ma
gplot.time = time
…after which this function can be re-run. Once the
slab edgesare reconstructed, they are converted into Shapely lines whose coordinates are passed to a geopandas GeoDataFrame. def get_subduction_direction(self, central_meridian=0.0, tessellate_degrees=None)-
Create a geopandas.GeoDataFrame object containing geometries of trench directions.
Notes
The
trench_leftandtrench_rightgeometries needed to produce the GeoDataFrame are automatically constructed if the optionaltimeparameter is passed to thePlotTopologiesobject before calling this function.timecan be passed either whenPlotTopologiesis first called…gplot = gplately.PlotTopologies(..., time=100,...)or anytime afterwards, by setting:
time = 100 #Ma
gplot.time = time
…after which this function can be re-run. Once the
othergeometries are reconstructed, they are converted into Shapely features whose coordinates are passed to a geopandas GeoDataFrame.Returns
gdf_left:instanceof<geopandas.GeoDataFrame>- A pandas.DataFrame that has a column with
trench_leftgeometry. gdf_right:instanceof<geopandas.GeoDataFrame>- A pandas.DataFrame that has a column with
trench_rightgeometry.
Raises
ValueError- If the optional
timeparameter has not been passed toPlotTopologies. This is needed to constructtrench_leftortrench_rightgeometries to the requestedtimeand thus populate the GeoDataFrame.
def get_sutures(self, central_meridian=0.0, tessellate_degrees=None)-
Create a geopandas.GeoDataFrame object containing geometries of reconstructed suture lines.
Parameters
central_meridian:float- Central meridian around which to perform wrapping; default: 0.0.
tessellate_degrees:floatorNone- If provided, geometries will be tessellated to this resolution prior to wrapping.
Returns
geopandas.GeoDataFrame- A pandas.DataFrame that has a column with
suturesgeometry.
Raises
ValueError- If the optional
timeparameter has not been passed toPlotTopologies. This is needed to constructsuturesto the requestedtimeand thus populate the GeoDataFrame.
Notes
The
suturesneeded to produce the GeoDataFrame are automatically constructed if the optionaltimeparameter is passed to thePlotTopologiesobject before calling this function.timecan be passed either whenPlotTopologiesis first called…gplot = gplately.PlotTopologies(..., time=100,...)or anytime afterwards, by setting:
time = 100 # Ma
gplot.time = time
…after which this function can be re-run. Once the
suturesare reconstructed, they are converted into Shapely lines whose coordinates are passed to a geopandas GeoDataFrame. def get_terrane_boundaries(self, central_meridian=0.0, tessellate_degrees=None)-
Create a geopandas.GeoDataFrame object containing geometries of reconstructed terrane boundary lines.
Parameters
central_meridian:float- Central meridian around which to perform wrapping; default: 0.0.
tessellate_degrees:floatorNone- If provided, geometries will be tessellated to this resolution prior to wrapping.
Returns
geopandas.GeoDataFrame- A pandas.DataFrame that has a column with
terrane boundariesgeometry.
Raises
ValueError- If the optional
timeparameter has not been passed toPlotTopologies. This is needed to constructterrane boundariesto the requestedtimeand thus populate the GeoDataFrame.
Notes
The
terrane boundariesneeded to produce the GeoDataFrame are automatically constructed if the optionaltimeparameter is passed to thePlotTopologiesobject before calling this function.timecan be passed either whenPlotTopologiesis first called…gplot = gplately.PlotTopologies(..., time=100,...)or anytime afterwards, by setting:
time = 100 # Ma
gplot.time = time
…after which this function can be re-run. Once the
terrane boundariesare reconstructed, they are converted into Shapely lines whose coordinates are passed to a geopandas GeoDataFrame. def get_topological_plate_boundaries(self, central_meridian=0.0, tessellate_degrees=1)-
Create a geopandas.GeoDataFrame object containing geometries of reconstructed rigid topological plate boundaries.
Parameters
central_meridian:float- Central meridian around which to perform wrapping; default: 0.0.
tessellate_degrees:floatorNone- If provided, geometries will be tessellated to this resolution prior to wrapping.
Returns
geopandas.GeoDataFrame- A pandas.DataFrame that has a column with
topological plate boundariesgeometry.
Raises
ValueError- If the optional
timeparameter has not been passed toPlotTopologies. This is needed to constructtopological plate boundariesto the requestedtimeand thus populate the GeoDataFrame.
Notes
The
topological plate boundariesneeded to produce the GeoDataFrame are automatically constructed if the optionaltimeparameter is passed to thePlotTopologiesobject before calling this function.timecan be passed either whenPlotTopologiesis first called…gplot = gplately.PlotTopologies(..., time=100,...)or anytime afterwards, by setting:
time = 100 # Ma
gplot.time = time
…after which this function can be re-run. Once the
topological plate boundariesare reconstructed, they are converted into Shapely lines whose coordinates are passed to a geopandas GeoDataFrame. def get_transforms(self, central_meridian=0.0, tessellate_degrees=None)-
Create a geopandas.GeoDataFrame object containing geometries of reconstructed transform lines(gpml:Transform).
Parameters
central_meridian:float- Central meridian around which to perform wrapping; default: 0.0.
tessellate_degrees:floatorNone- If provided, geometries will be tessellated to this resolution prior to wrapping.
Returns
geopandas.GeoDataFrame- A pandas.DataFrame that has a column with
transformsgeometry.
Raises
ValueError- If the optional
timeparameter has not been passed toPlotTopologies. This is needed to constructtransformsto the requestedtimeand thus populate the GeoDataFrame.
Notes
The
transformsneeded to produce the GeoDataFrame are automatically constructed if the optionaltimeparameter is passed to thePlotTopologiesobject before calling this function.timecan be passed either whenPlotTopologiesis first called…gplot = gplately.PlotTopologies(..., time=100,...)or anytime afterwards, by setting:
time = 100 # Ma
gplot.time = time
…after which this function can be re-run. Once the
transformsare reconstructed, they are converted into Shapely lines whose coordinates are passed to a geopandas GeoDataFrame. def get_transitional_crusts(self, central_meridian=0.0, tessellate_degrees=None)-
Create a geopandas.GeoDataFrame object containing geometries of reconstructed transitional crust lines.
Parameters
central_meridian:float- Central meridian around which to perform wrapping; default: 0.0.
tessellate_degrees:floatorNone- If provided, geometries will be tessellated to this resolution prior to wrapping.
Returns
geopandas.GeoDataFrame- A pandas.DataFrame that has a column with
transitional crustsgeometry.
Raises
ValueError- If the optional
timeparameter has not been passed toPlotTopologies. This is needed to constructtransitional cruststo the requestedtimeand thus populate the GeoDataFrame.
Notes
The
transitional crustsneeded to produce the GeoDataFrame are automatically constructed if the optionaltimeparameter is passed to thePlotTopologiesobject before calling this function.timecan be passed either whenPlotTopologiesis first called…gplot = gplately.PlotTopologies(..., time=100,...)or anytime afterwards, by setting:
time = 100 # Ma
gplot.time = time
…after which this function can be re-run. Once the
transitional crustsare reconstructed, they are converted into Shapely lines whose coordinates are passed to a geopandas GeoDataFrame. def get_trenches(self, central_meridian=0.0, tessellate_degrees=1)-
Create a geopandas.GeoDataFrame object containing geometries of reconstructed trench lines.
Parameters
central_meridian:float- Central meridian around which to perform wrapping; default: 0.0.
tessellate_degrees:floatorNone- If provided, geometries will be tessellated to this resolution prior to wrapping.
Returns
geopandas.GeoDataFrame- A pandas.DataFrame that has a column with
trenchesgeometry.
Raises
ValueError- If the optional
timeparameter has not been passed toPlotTopologies. This is needed to constructtrenchesto the requestedtimeand thus populate the GeoDataFrame.
Notes
The
trenchesneeded to produce the GeoDataFrame are automatically constructed if the optionaltimeparameter is passed to thePlotTopologiesobject before calling this function.timecan be passed either whenPlotTopologiesis first called…gplot = gplately.PlotTopologies(..., time=100,...)or anytime afterwards, by setting:
time = 100 # Ma
gplot.time = time
…after which this function can be re-run. Once the
trenchesare reconstructed, they are converted into Shapely lines whose coordinates are passed to a geopandas GeoDataFrame. def get_unclassified_features(self, central_meridian=0.0, tessellate_degrees=None)-
Create a geopandas.GeoDataFrame object containing geometries of reconstructed unclassified feature lines.
Parameters
central_meridian:float- Central meridian around which to perform wrapping; default: 0.0.
tessellate_degrees:floatorNone- If provided, geometries will be tessellated to this resolution prior to wrapping.
Returns
geopandas.GeoDataFrame- A pandas.DataFrame that has a column with
unclassified featuresgeometry.
Raises
ValueError- If the optional
timeparameter has not been passed toPlotTopologies. This is needed to constructunclassified featuresto the requestedtimeand thus populate the GeoDataFrame.
Notes
The
unclassified featuresneeded to produce the GeoDataFrame are automatically constructed if the optionaltimeparameter is passed to thePlotTopologiesobject before calling this function.timecan be passed either whenPlotTopologiesis first called…gplot = gplately.PlotTopologies(..., time=100,...)or anytime afterwards, by setting:
time = 100 # Ma
gplot.time = time
…after which this function can be re-run. Once the
unclassified featuresare reconstructed, they are converted into Shapely lines whose coordinates are passed to a geopandas GeoDataFrame. def plot_all_topological_sections(self, ax, color='black', **kwargs)-
Plot all topologies on a standard map projection.
Parameters
ax:instanceof<cartopy.mpl.geoaxes.GeoAxes>or<cartopy.mpl.geoaxes.GeoAxesSubplot>- A subclass of
matplotlib.axes.Axeswhich represents a map Projection. The map should be set at a particular Cartopy projection. color:str, default=’black’- The colour of the
topologieslines. By default, it is set to black.
**kwargs : Keyword arguments for parameters such as
alpha, etc. for plottingtopologiesgeometries. SeeMatplotlibkeyword arguments here.Returns
ax:instanceof<geopandas.GeoDataFrame.plot>- A standard cartopy.mpl.geoaxes.GeoAxes or cartopy.mpl.geoaxes.GeoAxesSubplot map
with
topologiesfeatures plotted onto the chosen map projection.
def plot_all_topologies(self, ax, color='black', **kwargs)-
Plot topological polygons and networks on a standard map projection.
Parameters
ax:instanceof<cartopy.mpl.geoaxes.GeoAxes>or<cartopy.mpl.geoaxes.GeoAxesSubplot>- A subclass of
matplotlib.axes.Axeswhich represents a map Projection. The map should be set at a particular Cartopy projection. color:str, default=’black’- The colour of the
topologieslines. By default, it is set to black.
**kwargs : Keyword arguments for parameters such as
alpha, etc. for plottingtopologiesgeometries. SeeMatplotlibkeyword arguments here.Returns
ax:instanceof<geopandas.GeoDataFrame.plot>- A standard cartopy.mpl.geoaxes.GeoAxes or cartopy.mpl.geoaxes.GeoAxesSubplot map
with
topologiesfeatures plotted onto the chosen map projection.
def plot_coastlines(self, ax, color='black', **kwargs)-
Plot reconstructed coastline polygons onto a standard map Projection.
Notes
The
coastlinesfor plotting are accessed from thePlotTopologiesobject'scoastlinesattribute. Thesecoastlinesare reconstructed to thetimepassed to thePlotTopologiesobject and converted into Shapely polylines. The reconstructedcoastlinesare added onto the GeoAxes or GeoAxesSubplot mapaxusing GeoPandas. Map resentation details (e.g. facecolor, edgecolor, alpha…) are permitted as keyword arguments.Parameters ---------- ax : instance of <cartopy.mpl.geoaxes.GeoAxes> or <cartopy.mpl.geoaxes.GeoAxesSubplot> A subclass of <code>matplotlib.axes.Axes</code> which represents a map Projection. The map should be set at a particular Cartopy projection. color : str, default=’black’ The colour of the <code>coastlines</code> lines. By default, it is set to black. **kwargs : Keyword arguments for parameters such as <code>alpha</code>, etc. for plotting <code>coastlines</code> geometries. See <code>Matplotlib</code> keyword arguments [here](https://matplotlib.org/stable/api/_as_gen/matplotlib.pyplot.plot.html). Returns ------- ax : instance of <geopandas.GeoDataFrame.plot> A standard cartopy.mpl.geoaxes.GeoAxes or cartopy.mpl.geoaxes.GeoAxesSubplot map with <code>coastlines</code> features plotted onto the chosen map projection. def plot_continent_ocean_boundaries(self, ax, color='black', **kwargs)-
Plot reconstructed continent-ocean boundary (COB) polygons onto a standard map Projection.
Notes
The
COBsfor plotting are accessed from thePlotTopologiesobject'sCOBsattribute. TheseCOBsare reconstructed to thetimepassed to thePlotTopologiesobject and converted into Shapely polylines. The reconstructedCOBsare plotted onto the GeoAxes or GeoAxesSubplot mapaxusing GeoPandas. Map presentation details (e.g.facecolor,edgecolor,alpha…) are permitted as keyword arguments.These COBs are transformed into shapely geometries and added onto the chosen map for a specific geological time (supplied to the PlotTopologies object). Map presentation details (e.g. facecolor, edgecolor, alpha…) are permitted.
    Parameters
    ----------
    ax : instance of <cartopy.mpl.geoaxes.GeoAxes> or <cartopy.mpl.geoaxes.GeoAxesSubplot>
        A subclass of <code>matplotlib.axes.Axes</code> which represents a map Projection.
        The map should be set at a particular Cartopy projection.

    color : str, default=’black’
        The colour of the <code>continent ocean boundaries</code> lines. By default, it is set to black.

    **kwargs :
        Keyword arguments for parameters such as <code>alpha</code>, etc. for plotting <code>continent ocean boundaries</code> geometries.
        See <code>Matplotlib</code> keyword arguments [here](https://matplotlib.org/stable/api/_as_gen/matplotlib.pyplot.plot.html).

    Returns
    -------
    ax : instance of <geopandas.GeoDataFrame.plot>
        A standard cartopy.mpl.geoaxes.GeoAxes or cartopy.mpl.geoaxes.GeoAxesSubplot map
        with <code>continent ocean boundaries</code> features plotted onto the chosen map projection.
def plot_continental_crusts(self, ax, color='black', **kwargs)-
Plot continental crust lines on a standard map projection.
Parameters
ax:instanceof<cartopy.mpl.geoaxes.GeoAxes>or<cartopy.mpl.geoaxes.GeoAxesSubplot>- A subclass of
matplotlib.axes.Axeswhich represents a map Projection. The map should be set at a particular Cartopy projection. color:str, default=’black’- The colour of the
continental crustslines. By default, it is set to black.
**kwargs : Keyword arguments for parameters such as
alpha, etc. for plottingcontinental crustsgeometries. SeeMatplotlibkeyword arguments here.Returns
ax:instanceof<geopandas.GeoDataFrame.plot>- A standard cartopy.mpl.geoaxes.GeoAxes or cartopy.mpl.geoaxes.GeoAxesSubplot map
with
continental crustsfeatures plotted onto the chosen map projection.
def plot_continental_rifts(self, ax, color='black', **kwargs)-
Plot continental rifts on a standard map projection.
Parameters
ax:instanceof<cartopy.mpl.geoaxes.GeoAxes>or<cartopy.mpl.geoaxes.GeoAxesSubplot>- A subclass of
matplotlib.axes.Axeswhich represents a map Projection. The map should be set at a particular Cartopy projection. color:str, default=’black’- The colour of the
continental riftslines. By default, it is set to black.
**kwargs : Keyword arguments for parameters such as
alpha, etc. for plottingcontinental riftsgeometries. SeeMatplotlibkeyword arguments here.Returns
ax:instanceof<geopandas.GeoDataFrame.plot>- A standard cartopy.mpl.geoaxes.GeoAxes or cartopy.mpl.geoaxes.GeoAxesSubplot map
with
continental riftsfeatures plotted onto the chosen map projection.
def plot_continents(self, ax, color='black', **kwargs)-
Plot reconstructed continental polygons onto a standard map Projection.
Notes
The
continentsfor plotting are accessed from thePlotTopologiesobject'scontinentsattribute. Thesecontinentsare reconstructed to thetimepassed to thePlotTopologiesobject and converted into Shapely polygons. The reconstructedcoastlinesare plotted onto the GeoAxes or GeoAxesSubplot mapaxusing GeoPandas. Map presentation details (e.g. facecolor, edgecolor, alpha…) are permitted as keyword arguments.Parameters ---------- ax : instance of <cartopy.mpl.geoaxes.GeoAxes> or <cartopy.mpl.geoaxes.GeoAxesSubplot> A subclass of <code>matplotlib.axes.Axes</code> which represents a map Projection. The map should be set at a particular Cartopy projection. color : str, default=’black’ The colour of the <code>continents</code> lines. By default, it is set to black. **kwargs : Keyword arguments for parameters such as <code>alpha</code>, etc. for plotting <code>continents</code> geometries. See <code>Matplotlib</code> keyword arguments [here](https://matplotlib.org/stable/api/_as_gen/matplotlib.pyplot.plot.html). Returns ------- ax : instance of <geopandas.GeoDataFrame.plot> A standard cartopy.mpl.geoaxes.GeoAxes or cartopy.mpl.geoaxes.GeoAxesSubplot map with <code>continents</code> features plotted onto the chosen map projection. def plot_extended_continental_crusts(self, ax, color='black', **kwargs)-
Plot extended continental crust lines on a standard map projection.
Parameters
ax:instanceof<cartopy.mpl.geoaxes.GeoAxes>or<cartopy.mpl.geoaxes.GeoAxesSubplot>- A subclass of
matplotlib.axes.Axeswhich represents a map Projection. The map should be set at a particular Cartopy projection. color:str, default=’black’- The colour of the
extended continental crustslines. By default, it is set to black.
**kwargs : Keyword arguments for parameters such as
alpha, etc. for plottingextended continental crustsgeometries. SeeMatplotlibkeyword arguments here.Returns
ax:instanceof<geopandas.GeoDataFrame.plot>- A standard cartopy.mpl.geoaxes.GeoAxes or cartopy.mpl.geoaxes.GeoAxesSubplot map
with
extended continental crustsfeatures plotted onto the chosen map projection.
def plot_faults(self, ax, color='black', **kwargs)-
Plot faults on a standard map projection.
Parameters
ax:instanceof<cartopy.mpl.geoaxes.GeoAxes>or<cartopy.mpl.geoaxes.GeoAxesSubplot>- A subclass of
matplotlib.axes.Axeswhich represents a map Projection. The map should be set at a particular Cartopy projection. color:str, default=’black’- The colour of the
faultslines. By default, it is set to black.
**kwargs : Keyword arguments for parameters such as
alpha, etc. for plottingfaultsgeometries. SeeMatplotlibkeyword arguments here.Returns
ax:instanceof<geopandas.GeoDataFrame.plot>- A standard cartopy.mpl.geoaxes.GeoAxes or cartopy.mpl.geoaxes.GeoAxesSubplot map
with
faultsfeatures plotted onto the chosen map projection.
def plot_feature(self, ax, feature, feature_name='', color='black', **kwargs)-
Plot pygplates.FeatureCollection or pygplates.Feature onto a map.
Parameters
ax:instanceof<cartopy.mpl.geoaxes.GeoAxes>or<cartopy.mpl.geoaxes.GeoAxesSubplot>- A subclass of
matplotlib.axes.Axeswhich represents a map Projection. The map should be set at a particular Cartopy projection. color:str, default=’black’- The colour of the
featurelines. By default, it is set to black.
**kwargs : Keyword arguments for parameters such as
alpha, etc. for plottingfeaturegeometries. SeeMatplotlibkeyword arguments here.Returns
ax:instanceof<geopandas.GeoDataFrame.plot>- A standard cartopy.mpl.geoaxes.GeoAxes or cartopy.mpl.geoaxes.GeoAxesSubplot map
with
featurefeatures plotted onto the chosen map projection.
def plot_fracture_zones(self, ax, color='black', **kwargs)-
Plot fracture zones on a standard map projection.
Parameters
ax:instanceof<cartopy.mpl.geoaxes.GeoAxes>or<cartopy.mpl.geoaxes.GeoAxesSubplot>- A subclass of
matplotlib.axes.Axeswhich represents a map Projection. The map should be set at a particular Cartopy projection. color:str, default=’black’- The colour of the
fracturezoneslines. By default, it is set to black.
**kwargs : Keyword arguments for parameters such as
alpha, etc. for plottingfracturezonesgeometries. SeeMatplotlibkeyword arguments here.Returns
ax:instanceof<geopandas.GeoDataFrame.plot>- A standard cartopy.mpl.geoaxes.GeoAxes or cartopy.mpl.geoaxes.GeoAxesSubplot map
with
fracturezonesfeatures plotted onto the chosen map projection.
def plot_grid(self, ax, grid, extent=[-180, 180, -90, 90], **kwargs)-
Plot a
MaskedArrayraster or grid onto a standard map Projection.Notes
Uses Matplotlib's
imshowfunction.Parameters
ax:instanceof<cartopy.mpl.geoaxes.GeoAxes>or<cartopy.mpl.geoaxes.GeoAxesSubplot>- A subclass of
matplotlib.axes.Axeswhich represents a map Projection. The map should be set at a particular Cartopy projection. grid:MaskedArrayorRaster- A
MaskedArraywith elements that define a grid. The number of rows in the raster corresponds to the number of latitudinal coordinates, while the number of raster columns corresponds to the number of longitudinal coordinates. extent:1d array, default=[-180,180,-90,90]- A four-element array to specify the [min lon, max lon, min lat, max lat] with which to constrain the grid image. If no extents are supplied, full global extent is assumed.
**kwargs : Keyword arguments for map presentation parameters such as
alpha, etc. for plotting the grid. SeeMatplotlib'simshowkeyword arguments here.Returns
ax:instanceof<geopandas.GeoDataFrame.plot>- A standard cartopy.mpl.geoaxes.GeoAxes or cartopy.mpl.geoaxes.GeoAxesSubplot map with the grid plotted onto the chosen map projection.
def plot_grid_from_netCDF(self, ax, filename, **kwargs)-
Read a raster from a netCDF file, convert it to a
MaskedArrayand plot it onto a standard map Projection.Notes
plot_grid_from_netCDFuses Matplotlib'simshowfunction.Parameters
ax:instanceof<cartopy.mpl.geoaxes.GeoAxes>or<cartopy.mpl.geoaxes.GeoAxesSubplot>- A subclass of
matplotlib.axes.Axeswhich represents a map Projection. The map should be set at a particular Cartopy projection. filename:str- Full path to a netCDF filename.
**kwargs : Keyword arguments for map presentation parameters for plotting the grid. See
Matplotlib'simshowkeyword arguments here.Returns
ax:instanceof<geopandas.GeoDataFrame.plot>- A standard cartopy.mpl.geoaxes.GeoAxes or cartopy.mpl.geoaxes.GeoAxesSubplot map with the netCDF grid plotted onto the chosen map projection.
def plot_inferred_paleo_boundaries(self, ax, color='black', **kwargs)-
Plot inferred paleo boundaries on a standard map projection.
Parameters
ax:instanceof<cartopy.mpl.geoaxes.GeoAxes>or<cartopy.mpl.geoaxes.GeoAxesSubplot>- A subclass of
matplotlib.axes.Axeswhich represents a map Projection. The map should be set at a particular Cartopy projection. color:str, default=’black’- The colour of the
inferred paleo-boundarieslines. By default, it is set to black.
**kwargs : Keyword arguments for parameters such as
alpha, etc. for plottinginferred paleo-boundariesgeometries. SeeMatplotlibkeyword arguments here.Returns
ax:instanceof<geopandas.GeoDataFrame.plot>- A standard cartopy.mpl.geoaxes.GeoAxes or cartopy.mpl.geoaxes.GeoAxesSubplot map
with
inferred paleo-boundariesfeatures plotted onto the chosen map projection.
def plot_misc_boundaries(self, ax, color='black', **kwargs)-
Plot reconstructed miscellaneous plate boundary polylines onto a standard map Projection.
Notes
The miscellaneous boundary sections for plotting are accessed from the
PlotTopologiesobject'sotherattribute. Theseotherboundaries are reconstructed to thetimepassed to thePlotTopologiesobject and converted into Shapely polylines. The reconstructedotherboundaries are plotted onto the GeoAxes or GeoAxesSubplot mapaxusing GeoPandas. Map presentation details (e.g.facecolor,edgecolor,alpha…) are permitted as keyword arguments.Miscellaneous boundary geometries are wrapped to the dateline using pyGPlates' DateLineWrapper by splitting a polyline into multiple polylines at the dateline. This is to avoid horizontal lines being formed between polylines at longitudes of -180 and 180 degrees. Point features near the poles (-89 & 89 degree latitude) are also clipped to ensure compatibility with Cartopy.
    Parameters
    ----------
    ax : instance of <cartopy.mpl.geoaxes.GeoAxes> or <cartopy.mpl.geoaxes.GeoAxesSubplot>
        A subclass of <code>matplotlib.axes.Axes</code> which represents a map Projection.
        The map should be set at a particular Cartopy projection.

    color : str, default=’black’
        The colour of the <code>other</code> lines. By default, it is set to black.

    **kwargs :
        Keyword arguments for parameters such as <code>alpha</code>, etc. for plotting <code>other</code> geometries.
        See <code>Matplotlib</code> keyword arguments [here](https://matplotlib.org/stable/api/_as_gen/matplotlib.pyplot.plot.html).

    Returns
    -------
    ax : instance of <geopandas.GeoDataFrame.plot>
        A standard cartopy.mpl.geoaxes.GeoAxes or cartopy.mpl.geoaxes.GeoAxesSubplot map
        with <code>other</code> features plotted onto the chosen map projection.
def plot_misc_transforms(self, ax, color='black', **kwargs)-
Deprecated! DO NOT USE.
def plot_orogenic_belts(self, ax, color='black', **kwargs)-
Plot orogenic belts on a standard map projection.
Parameters
ax:instanceof<cartopy.mpl.geoaxes.GeoAxes>or<cartopy.mpl.geoaxes.GeoAxesSubplot>- A subclass of
matplotlib.axes.Axeswhich represents a map Projection. The map should be set at a particular Cartopy projection. color:str, default=’black’- The colour of the
orogenic beltslines. By default, it is set to black.
**kwargs : Keyword arguments for parameters such as
alpha, etc. for plottingorogenic beltsgeometries. SeeMatplotlibkeyword arguments here.Returns
ax:instanceof<geopandas.GeoDataFrame.plot>- A standard cartopy.mpl.geoaxes.GeoAxes or cartopy.mpl.geoaxes.GeoAxesSubplot map
with
orogenic beltsfeatures plotted onto the chosen map projection.
def plot_passive_continental_boundaries(self, ax, color='black', **kwargs)-
Plot passive continental boundaries on a standard map projection.
Parameters
ax:instanceof<cartopy.mpl.geoaxes.GeoAxes>or<cartopy.mpl.geoaxes.GeoAxesSubplot>- A subclass of
matplotlib.axes.Axeswhich represents a map Projection. The map should be set at a particular Cartopy projection. color:str, default=’black’- The colour of the
passive continental boundarieslines. By default, it is set to black.
**kwargs : Keyword arguments for parameters such as
alpha, etc. for plottingpassive continental boundariesgeometries. SeeMatplotlibkeyword arguments here.Returns
ax:instanceof<geopandas.GeoDataFrame.plot>- A standard cartopy.mpl.geoaxes.GeoAxes or cartopy.mpl.geoaxes.GeoAxesSubplot map
with
passive continental boundariesfeatures plotted onto the chosen map projection.
def plot_plate_id(self, *args, **kwargs)-
TODO: remove this function
The function name plot_plate_id() is bad and should be changed. The new name is plot_plate_polygon_by_id(). For backward compatibility, we allow users to use the old name in their legcy code for now. No new code should call this function.
def plot_plate_motion_vectors(self, ax, spacingX=10, spacingY=10, normalise=False, **kwargs)-
Calculate plate motion velocity vector fields at a particular geological time and plot them onto a standard map Projection.
Notes
plot_plate_motion_vectorsgenerates a MeshNode domain of point features using given spacings in the X and Y directions (spacingXandspacingY). Each point in the domain is assigned a plate ID, and these IDs are used to obtain equivalent stage rotations of identified tectonic plates over a 5 Ma time interval. Each point and its stage rotation are used to calculate plate velocities at a particular geological time. Velocities for each domain point are represented in the north-east-down coordinate system and plotted on a GeoAxes.Vector fields can be optionally normalised by setting
normalisetoTrue. This makes vector arrow lengths uniform.Parameters
ax:instanceof<cartopy.mpl.geoaxes.GeoAxes>or<cartopy.mpl.geoaxes.GeoAxesSubplot>- A subclass of
matplotlib.axes.Axeswhich represents a map Projection. The map should be set at a particular Cartopy projection. spacingX:int, default=10- The spacing in the X direction used to make the velocity domain point feature mesh.
spacingY:int, default=10- The spacing in the Y direction used to make the velocity domain point feature mesh.
normalise:bool, default=False- Choose whether to normalise the velocity magnitudes so that vector lengths are all equal.
**kwargs : Keyword arguments for quiver presentation parameters for plotting the velocity vector field. See
Matplotlibquiver keyword arguments here.Returns
ax:instanceof<geopandas.GeoDataFrame.plot>- A standard cartopy.mpl.geoaxes.GeoAxes or cartopy.mpl.geoaxes.GeoAxesSubplot map with the velocity vector field plotted onto the chosen map projection.
def plot_plate_polygon_by_id(self, ax, plate_id, color='black', **kwargs)-
Plot a plate polygon with an associated
plate_idonto a standard map Projection.Parameters
ax:instanceof<cartopy.mpl.geoaxes.GeoAxes>or<cartopy.mpl.geoaxes.GeoAxesSubplot>- A subclass of
matplotlib.axes.Axeswhich represents a map Projection. The map should be set at a particular Cartopy projection. plate_id:int- A plate ID that identifies the continental polygon to plot. See the Global EarthByte plate IDs list for a full list of plate IDs to plot.
**kwargs : Keyword arguments for map presentation parameters such as
alpha, etc. for plotting the grid. SeeMatplotlib'simshowkeyword arguments here. def plot_pole(self, ax, lon, lat, a95, **kwargs)-
Plot pole onto a matplotlib axes.
Parameters
ax:instanceof<cartopy.mpl.geoaxes.GeoAxes>or<cartopy.mpl.geoaxes.GeoAxesSubplot>- A subclass of
matplotlib.axes.Axeswhich represents a map Projection. The map should be set at a particular Cartopy projection. lon:float- Longitudinal coordinate to place pole
lat:float- Latitudinal coordinate to place pole
a95:float- The size of the pole (in degrees)
Returns
matplotlib.patches.Circle handle
def plot_ridges(self, ax, color='black', **kwargs)-
Plot reconstructed mid-ocean ridge lines(gpml:MidOceanRidge) onto a map.
Notes
The
ridgessections for plotting are accessed from thePlotTopologiesobject'sridgesattribute. Theseridgesare reconstructed to thetimepassed to thePlotTopologiesobject and converted into Shapely polylines. The reconstructedridgesare plotted onto the GeoAxes or GeoAxesSubplot mapaxusing GeoPandas. Map presentation details (e.g.facecolor,edgecolor,alpha…) are permitted as keyword arguments.Note: The
ridgesgeometries are wrapped to the dateline using pyGPlates' DateLineWrapper by splitting a polyline into multiple polylines at the dateline. This is to avoid horizontal lines being formed between polylines at longitudes of -180 and 180 degrees. Point features near the poles (-89 & 89 degree latitude) are also clipped to ensure compatibility with Cartopy.Parameters ---------- ax : instance of <cartopy.mpl.geoaxes.GeoAxes> or <cartopy.mpl.geoaxes.GeoAxesSubplot> A subclass of <code>matplotlib.axes.Axes</code> which represents a map Projection. The map should be set at a particular Cartopy projection. color : str, default=’black’ The colour of the <code>ridges</code> lines. By default, it is set to black. **kwargs : Keyword arguments for parameters such as <code>alpha</code>, etc. for plotting <code>ridges</code> geometries. See <code>Matplotlib</code> keyword arguments [here](https://matplotlib.org/stable/api/_as_gen/matplotlib.pyplot.plot.html). Returns ------- ax : instance of <geopandas.GeoDataFrame.plot> A standard cartopy.mpl.geoaxes.GeoAxes or cartopy.mpl.geoaxes.GeoAxesSubplot map with <code>ridges</code> features plotted onto the chosen map projection. def plot_ridges_and_transforms(self, ax, color='black', **kwargs)-
Deprecated! DO NOT USE!
def plot_slab_edges(self, ax, color='black', **kwargs)-
Plot slab edges on a standard map projection.
Parameters
ax:instanceof<cartopy.mpl.geoaxes.GeoAxes>or<cartopy.mpl.geoaxes.GeoAxesSubplot>- A subclass of
matplotlib.axes.Axeswhich represents a map Projection. The map should be set at a particular Cartopy projection. color:str, default=’black’- The colour of the
slab edgeslines. By default, it is set to black.
**kwargs : Keyword arguments for parameters such as
alpha, etc. for plottingslab edgesgeometries. SeeMatplotlibkeyword arguments here.Returns
ax:instanceof<geopandas.GeoDataFrame.plot>- A standard cartopy.mpl.geoaxes.GeoAxes or cartopy.mpl.geoaxes.GeoAxesSubplot map
with
slab edgesfeatures plotted onto the chosen map projection.
def plot_subduction_teeth(self, ax, spacing=0.07, size=None, aspect=None, color='black', **kwargs) ‑> None-
Plot subduction teeth onto a standard map Projection.
Notes
Subduction teeth are tessellated from
PlotTopologiesobject attributestrench_leftandtrench_right, and transformed into Shapely polygons for plotting.Parameters
ax:instanceof<cartopy.mpl.geoaxes.GeoAxes>or<cartopy.mpl.geoaxes.GeoAxesSubplot>- A subclass of
matplotlib.axes.Axeswhich represents a map Projection. The map should be set at a particular Cartopy projection. spacing:float, default=0.07- The tessellation threshold (in radians). Parametrises subduction tooth density.
Triangles are generated only along line segments with distances that exceed
the given threshold
spacing. size:float, default=None- Length of teeth triangle base (in radians). If kept at
None, thensize = 0.5*spacing. aspect:float, default=None- Aspect ratio of teeth triangles. If kept at
None, thenaspect = 2/3*size. color:str, default='black'- The colour of the teeth. By default, it is set to black.
**kwargs : Keyword arguments parameters such as
alpha, etc. for plotting subduction tooth polygons. SeeMatplotlibkeyword arguments here. def plot_subduction_teeth_deprecated(self, ax, spacing=0.1, size=2.0, aspect=1, color='black', **kwargs)-
Plot subduction teeth onto a standard map Projection.
Notes
Subduction teeth are tessellated from
PlotTopologiesobject attributestrench_leftandtrench_right, and transformed into Shapely polygons for plotting.Parameters
ax:instanceof<cartopy.mpl.geoaxes.GeoAxes>or<cartopy.mpl.geoaxes.GeoAxesSubplot>- A subclass of
matplotlib.axes.Axeswhich represents a map Projection. The map should be set at a particular Cartopy projection. spacing:float, default=0.1- The tessellation threshold (in radians). Parametrises subduction tooth density. Triangles are generated only along line segments with distances that exceed the given threshold ‘spacing’.
size:float, default=2.0- Length of teeth triangle base.
aspect:float, default=1- Aspect ratio of teeth triangles. Ratio is 1.0 by default.
color:str, default=’black’- The colour of the teeth. By default, it is set to black.
**kwargs : Keyword arguments for parameters such as ‘alpha’, etc. for plotting subduction tooth polygons. See
Matplotlibkeyword arguments here.Returns
ax:instanceof<geopandas.GeoDataFrame.plot>- A standard cartopy.mpl.geoaxes.GeoAxes or cartopy.mpl.geoaxes.GeoAxesSubplot map with subduction teeth plotted onto the chosen map projection.
def plot_sutures(self, ax, color='black', **kwargs)-
Plot sutures on a standard map projection.
Parameters
ax:instanceof<cartopy.mpl.geoaxes.GeoAxes>or<cartopy.mpl.geoaxes.GeoAxesSubplot>- A subclass of
matplotlib.axes.Axeswhich represents a map Projection. The map should be set at a particular Cartopy projection. color:str, default=’black’- The colour of the
sutureslines. By default, it is set to black.
**kwargs : Keyword arguments for parameters such as
alpha, etc. for plottingsuturesgeometries. SeeMatplotlibkeyword arguments here.Returns
ax:instanceof<geopandas.GeoDataFrame.plot>- A standard cartopy.mpl.geoaxes.GeoAxes or cartopy.mpl.geoaxes.GeoAxesSubplot map
with
suturesfeatures plotted onto the chosen map projection.
def plot_terrane_boundaries(self, ax, color='black', **kwargs)-
Plot terrane boundaries on a standard map projection.
Parameters
ax:instanceof<cartopy.mpl.geoaxes.GeoAxes>or<cartopy.mpl.geoaxes.GeoAxesSubplot>- A subclass of
matplotlib.axes.Axeswhich represents a map Projection. The map should be set at a particular Cartopy projection. color:str, default=’black’- The colour of the
terrane boundarieslines. By default, it is set to black.
**kwargs : Keyword arguments for parameters such as
alpha, etc. for plottingterrane boundariesgeometries. SeeMatplotlibkeyword arguments here.Returns
ax:instanceof<geopandas.GeoDataFrame.plot>- A standard cartopy.mpl.geoaxes.GeoAxes or cartopy.mpl.geoaxes.GeoAxesSubplot map
with
terrane boundariesfeatures plotted onto the chosen map projection.
def plot_topological_plate_boundaries(self, ax, color='black', **kwargs)-
Parameters
ax:instanceof<cartopy.mpl.geoaxes.GeoAxes>or<cartopy.mpl.geoaxes.GeoAxesSubplot>- A subclass of
matplotlib.axes.Axeswhich represents a map Projection. The map should be set at a particular Cartopy projection. color:str, default=’black’- The colour of the
topological plate boundarieslines. By default, it is set to black.
**kwargs : Keyword arguments for parameters such as
alpha, etc. for plottingtopological plate boundariesgeometries. SeeMatplotlibkeyword arguments here.Returns
ax:instanceof<geopandas.GeoDataFrame.plot>- A standard cartopy.mpl.geoaxes.GeoAxes or cartopy.mpl.geoaxes.GeoAxesSubplot map
with
topological plate boundariesfeatures plotted onto the chosen map projection.
def plot_transforms(self, ax, color='black', **kwargs)-
Plot transform boundaries(gpml:Transform) onto a map.
Parameters
ax:instanceof<cartopy.mpl.geoaxes.GeoAxes>or<cartopy.mpl.geoaxes.GeoAxesSubplot>- A subclass of
matplotlib.axes.Axeswhich represents a map Projection. The map should be set at a particular Cartopy projection. color:str, default=’black’- The colour of the
transformslines. By default, it is set to black.
**kwargs : Keyword arguments for parameters such as
alpha, etc. for plottingtransformsgeometries. SeeMatplotlibkeyword arguments here.Returns
ax:instanceof<geopandas.GeoDataFrame.plot>- A standard cartopy.mpl.geoaxes.GeoAxes or cartopy.mpl.geoaxes.GeoAxesSubplot map
with
transformsfeatures plotted onto the chosen map projection.
def plot_transitional_crusts(self, ax, color='black', **kwargs)-
Plot transitional crust on a standard map projection.
Parameters
ax:instanceof<cartopy.mpl.geoaxes.GeoAxes>or<cartopy.mpl.geoaxes.GeoAxesSubplot>- A subclass of
matplotlib.axes.Axeswhich represents a map Projection. The map should be set at a particular Cartopy projection. color:str, default=’black’- The colour of the
transitional crustslines. By default, it is set to black.
**kwargs : Keyword arguments for parameters such as
alpha, etc. for plottingtransitional crustsgeometries. SeeMatplotlibkeyword arguments here.Returns
ax:instanceof<geopandas.GeoDataFrame.plot>- A standard cartopy.mpl.geoaxes.GeoAxes or cartopy.mpl.geoaxes.GeoAxesSubplot map
with
transitional crustsfeatures plotted onto the chosen map projection.
def plot_trenches(self, ax, color='black', **kwargs)-
Plot reconstructed subduction trench polylines onto a standard map Projection.
Notes
The trench sections for plotting are accessed from the
PlotTopologiesobject'strenchesattribute. Thesetrenchesare reconstructed to thetimepassed to thePlotTopologiesobject and converted into Shapely polylines. The reconstructedtrenchesare plotted onto the GeoAxes or GeoAxesSubplot mapaxusing GeoPandas. Map presentation details (e.g.facecolor,edgecolor,alpha…) are permitted as keyword arguments.Trench geometries are wrapped to the dateline using pyGPlates' DateLineWrapper by splitting a polyline into multiple polylines at the dateline. This is to avoid horizontal lines being formed between polylines at longitudes of -180 and 180 degrees. Point features near the poles (-89 & 89 degree latitude) are also clipped to ensure compatibility with Cartopy.
    Parameters
    ----------
    ax : instance of <cartopy.mpl.geoaxes.GeoAxes> or <cartopy.mpl.geoaxes.GeoAxesSubplot>
        A subclass of <code>matplotlib.axes.Axes</code> which represents a map Projection.
        The map should be set at a particular Cartopy projection.

    color : str, default=’black’
        The colour of the <code>trenches</code> lines. By default, it is set to black.

    **kwargs :
        Keyword arguments for parameters such as <code>alpha</code>, etc. for plotting <code>trenches</code> geometries.
        See <code>Matplotlib</code> keyword arguments [here](https://matplotlib.org/stable/api/_as_gen/matplotlib.pyplot.plot.html).

    Returns
    -------
    ax : instance of <geopandas.GeoDataFrame.plot>
        A standard cartopy.mpl.geoaxes.GeoAxes or cartopy.mpl.geoaxes.GeoAxesSubplot map
        with <code>trenches</code> features plotted onto the chosen map projection.
def plot_unclassified_features(self, ax, color='black', **kwargs)-
Plot GPML unclassified features on a standard map projection.
Parameters
ax:instanceof<cartopy.mpl.geoaxes.GeoAxes>or<cartopy.mpl.geoaxes.GeoAxesSubplot>- A subclass of
matplotlib.axes.Axeswhich represents a map Projection. The map should be set at a particular Cartopy projection. color:str, default=’black’- The colour of the
unclassified featureslines. By default, it is set to black.
**kwargs : Keyword arguments for parameters such as
alpha, etc. for plottingunclassified featuresgeometries. SeeMatplotlibkeyword arguments here.Returns
ax:instanceof<geopandas.GeoDataFrame.plot>- A standard cartopy.mpl.geoaxes.GeoAxes or cartopy.mpl.geoaxes.GeoAxesSubplot map
with
unclassified featuresfeatures plotted onto the chosen map projection.
def update_time(self, time)-
Re-reconstruct features and topologies to the time specified by the
PlotTopologiestimeattribute whenever it or the anchor plate is updated.Notes
The following
PlotTopologiesattributes are updated whenever a reconstructiontimeattribute is set:- resolved topology features (topological plates and networks)
- ridge and transform boundary sections (resolved features)
- ridge boundary sections (resolved features)
- transform boundary sections (resolved features)
- subduction boundary sections (resolved features)
- left subduction boundary sections (resolved features)
- right subduction boundary sections (resolved features)
- other boundary sections (resolved features) that are not subduction zones or mid-ocean ridges (ridge/transform)
Moreover, coastlines, continents and COBs are reconstructed to the new specified
time.
class Points (plate_reconstruction, lons, lats, time=0, plate_id=None, age=inf, *, anchor_plate_id=None, remove_unreconstructable_points=False)-
Pointscontains methods to reconstruct and work with with geological point data. For example, the locations and plate velocities of point data can be calculated at a specific geologicaltime. ThePointsobject requires thePlateReconstructionobject to work because it holds therotation_modelneeded to quantify point rotations through time andstatic_polygonsneeded to partition points into plates.Attributes
plate_reconstruction:PlateReconstruction- Allows for the accessibility of
PlateReconstructionobject attributes:rotation_model,topology_featuesandstatic_polygonsfor use in thePointsobject if called using “self.plate_reconstruction.X”, where X is the attribute. lons:float 1D array- A 1D array containing the longitudes of point data.
These are the longitudes of the initial points at the initial
time. lats:float 1D array- A 1D array containing the latitudes of point data.
These are the latitudes of the initial points at the initial
time. plate_id:int 1D array- A 1D array containing the plate IDs of the points.
The length matches that of
lonsandlats. age:float 1D array- A 1D array containing the ages (time of appearance) of the points.
The length matches that of
lonsandlats. For points on oceanic crust this is when they were created at a mid-ocean ridge. Any points existing for all time will have a value ofnumpy.inf(equivalent tofloat('inf')). size:int- Number of points.
This is the size of
lons,lats,plate_idandage. time:float- The initial time (Ma) of the points.
The initial
lonsandlatsare the locations of the points at this time. anchor_plate_id:int- Anchor plate that the initial
lonsandlatsare relative to, at the initialtime. This is also used as the default anchor plate when reconstructing the points. It does not change, even if the anchor plate ofplate_reconstructionsubsequently changes.
Parameters
plate_reconstruction:PlateReconstruction- Allows for the accessibility of
PlateReconstructionobject attributes:rotation_model,topology_featuesandstatic_polygonsfor use in thePointsobject if called using “self.plate_reconstruction.X”, where X is the attribute. lons:floator1D array- These are the longitudes of the initial points at the initial
time. A single float, or a 1D array, containing the longitudes of point data. If a single float thenlatsmust also be a single float. If a 1D array thenlatsmust also be a 1D array. lats:floator1D array- These are the latitudes of the initial points at the initial
time. A single float, or a 1D array, containing the latitudes of point data. If a single float thenlonsmust also be a single float. If a 1D array thenlonsmust also be a 1D array. time:float, default=0- The initial time (Ma) of the points.
Note that
lonsandlatsare the initial locations of the points at this time. By default, it is set to the present day (0 Ma). plate_id:intor1D arrayorNone, default=None- Plate ID(s) of a particular tectonic plate on which point data lies, if known.
If a single integer then all points will have the same plate ID. If a 1D array then length must match the number of points.
If
Nonethen plate IDs are determined using thestatic_polygonsofplate_reconstruction(see Notes). By default, the plate IDs are determined using the static polygons. age:floator1D arrayorNone, default=numpy.inf- Age(s) at which each point appears, if known.
If a single float then all points will have the same age. If a 1D array then length must match the number of points.
If
Nonethen ages are determined using thestatic_polygonsofplate_reconstruction(see Notes). For points on oceanic crust this is when they were created at a mid-ocean ridge. By default, all points exist for all time (ie, time of appearance is infinity). This default is for backward compatibility, but you'll typically only want this if all your points are on continental crust (not oceanic). anchor_plate_id:int, optional- Anchor plate that the specified
lonsandlatsare relative to. Defaults to the current anchor plate ID ofplate_reconstruction(itsanchor_plate_idattribute). remove_unreconstructable_points:boolorlist, default=False- Whether to remove points (in
lonsandlats) that cannot be reconstructed. By default, any unreconstructable points are retained. A point cannot be reconstructed if it cannot be assigned a plate ID, or cannot be assigned an age, because it did not intersect any reconstructed static polygons (note that this can only happen whenplate_idand/orageis None). Also, a point cannot be reconstructed if point ages were explicitly provided (ie,agewas not None) and a point's age was less than (younger than)time, meaning it did not exist as far back astime. Additionally, if this variable is a regular Pythonlistthen the indices (into the suppliedlonsandlatsarguments) of any removed points (ie, that are unreconstructable) are appended to that list.
Notes
If
timeis non-zero (ie, not present day) thenlonsandlatsare assumed to be the reconstructed point locations attime. And the reconstructed positions are assumed to be relative to the anchor plate (which isplate_reconstruction.anchor_plate_idifanchor_plate_idis None).If
plate_idand/orageisNonethen the plate ID and/or age of each point is determined by reconstructing the static polygons ofplate_reconstructiontotimeand reconstructing relative to the anchor plate (regardless of whethertimeis present day or not). And then, for each point, assigning the plate ID and/or time-of-appearance (begin time) of the static polygon containing the point.A point is considered unreconstructable if it does not exist at
time. This can happen if its age was explicitly provided (ie,ageis not None) but is younger thantime. It can also happen if the point is automatically assigned a plate ID (ie,plate_idis None) or an age (ie,ageis None) but does not intersect any reconstructed static polygons (attime). In either of these cases it is marked as unreconstructable and will not be available for any method outputing a reconstruction, such asreconstruct, or any method depending on a reconstruction, such asplate_velocity. However, all the initial locations and their associated plate IDs and ages will still be accessible as attributes, regardless of whether all the points are reconstructable or not. That is, unlessremove_unreconstructable_pointsis True (or alist), in which case only the reconstructable points are retained.Expand source code
class Points(object): """`Points` contains methods to reconstruct and work with with geological point data. For example, the locations and plate velocities of point data can be calculated at a specific geological `time`. The `Points` object requires the `PlateReconstruction` object to work because it holds the `rotation_model` needed to quantify point rotations through time and `static_polygons` needed to partition points into plates. Attributes ---------- plate_reconstruction : PlateReconstruction Allows for the accessibility of `PlateReconstruction` object attributes: `rotation_model`, `topology_featues` and `static_polygons` for use in the `Points` object if called using “self.plate_reconstruction.X”, where X is the attribute. lons : float 1D array A 1D array containing the longitudes of point data. These are the longitudes of the initial points at the initial `time`. lats : float 1D array A 1D array containing the latitudes of point data. These are the latitudes of the initial points at the initial `time`. plate_id : int 1D array A 1D array containing the plate IDs of the points. The length matches that of `lons` and `lats`. age : float 1D array A 1D array containing the ages (time of appearance) of the points. The length matches that of `lons` and `lats`. For points on oceanic crust this is when they were created at a mid-ocean ridge. Any points existing for all time will have a value of `numpy.inf` (equivalent to `float('inf')`). size : int Number of points. This is the size of `lons`, `lats`, `plate_id` and `age`. time : float The initial time (Ma) of the points. The initial `lons` and `lats` are the locations of the points at this time. anchor_plate_id : int Anchor plate that the initial `lons` and `lats` are relative to, at the initial `time`. This is also used as the default anchor plate when reconstructing the points. It does not change, even if the anchor plate of `plate_reconstruction` subsequently changes. """ def __init__( self, plate_reconstruction, lons, lats, time=0, plate_id=None, age=np.inf, *, anchor_plate_id=None, remove_unreconstructable_points=False, ): """ Parameters ---------- plate_reconstruction : PlateReconstruction Allows for the accessibility of `PlateReconstruction` object attributes: `rotation_model`, `topology_featues` and `static_polygons` for use in the `Points` object if called using “self.plate_reconstruction.X”, where X is the attribute. lons : float or 1D array These are the longitudes of the initial points at the initial `time`. A single float, or a 1D array, containing the longitudes of point data. If a single float then `lats` must also be a single float. If a 1D array then `lats` must also be a 1D array. lats : float or 1D array These are the latitudes of the initial points at the initial `time`. A single float, or a 1D array, containing the latitudes of point data. If a single float then `lons` must also be a single float. If a 1D array then `lons` must also be a 1D array. time : float, default=0 The initial time (Ma) of the points. Note that `lons` and `lats` are the initial locations of the points at this time. By default, it is set to the present day (0 Ma). plate_id : int or 1D array or None, default=None Plate ID(s) of a particular tectonic plate on which point data lies, if known. If a single integer then all points will have the same plate ID. If a 1D array then length must match the number of points. If `None` then plate IDs are determined using the `static_polygons` of `plate_reconstruction` (see Notes). By default, the plate IDs are determined using the static polygons. age : float or 1D array or None, default=numpy.inf Age(s) at which each point appears, if known. If a single float then all points will have the same age. If a 1D array then length must match the number of points. If `None` then ages are determined using the `static_polygons` of `plate_reconstruction` (see Notes). For points on oceanic crust this is when they were created at a mid-ocean ridge. By default, all points exist for all time (ie, time of appearance is infinity). This default is for backward compatibility, but you'll typically only want this if all your points are on *continental* crust (not *oceanic*). anchor_plate_id : int, optional Anchor plate that the specified `lons` and `lats` are relative to. Defaults to the current anchor plate ID of `plate_reconstruction` (its `anchor_plate_id` attribute). remove_unreconstructable_points : bool or list, default=False Whether to remove points (in `lons` and `lats`) that cannot be reconstructed. By default, any unreconstructable points are retained. A point cannot be reconstructed if it cannot be assigned a plate ID, or cannot be assigned an age, because it did not intersect any reconstructed static polygons (note that this can only happen when `plate_id` and/or `age` is None). Also, a point cannot be reconstructed if point ages were *explicitly* provided (ie, `age` was *not* None) and a point's age was less than (younger than) `time`, meaning it did not exist as far back as `time`. Additionally, if this variable is a regular Python `list` then the indices (into the supplied `lons` and `lats` arguments) of any removed points (ie, that are unreconstructable) are appended to that list. Notes ----- If `time` is non-zero (ie, not present day) then `lons` and `lats` are assumed to be the *reconstructed* point locations at `time`. And the reconstructed positions are assumed to be relative to the anchor plate (which is `plate_reconstruction.anchor_plate_id` if `anchor_plate_id` is None). If `plate_id` and/or `age` is `None` then the plate ID and/or age of each point is determined by reconstructing the static polygons of `plate_reconstruction` to `time` and reconstructing relative to the anchor plate (regardless of whether `time` is present day or not). And then, for each point, assigning the plate ID and/or time-of-appearance (begin time) of the static polygon containing the point. A point is considered unreconstructable if it does not exist at `time`. This can happen if its age was explicitly provided (ie, `age` is *not* None) but is younger than `time`. It can also happen if the point is automatically assigned a plate ID (ie, `plate_id` is None) or an age (ie, `age` is None) but does not intersect any reconstructed static polygons (at `time`). In either of these cases it is marked as unreconstructable and will not be available for any method outputing a reconstruction, such as `reconstruct`, or any method depending on a reconstruction, such as `plate_velocity`. However, all the initial locations and their associated plate IDs and ages will still be accessible as attributes, regardless of whether all the points are reconstructable or not. That is, unless `remove_unreconstructable_points` is True (or a `list`), in which case only the reconstructable points are retained. """ # If anchor plate is None then use default anchor plate of 'plate_reconstruction'. if anchor_plate_id is None: anchor_plate_id = plate_reconstruction.anchor_plate_id else: anchor_plate_id = self._check_anchor_plate_id(anchor_plate_id) # The caller can specify a 'list' for the 'remove_unreconstructable_points' argument if they want us to # return the indices of any points that are NOT reconstructable. # # Otherwise 'remove_unreconstructable_points' must be true or false. if isinstance(remove_unreconstructable_points, list): unreconstructable_point_indices_list = remove_unreconstructable_points remove_unreconstructable_points = True else: unreconstructable_point_indices_list = None # Most common case first: both are sequences. if not np.isscalar(lons) and not np.isscalar(lats): # Make sure numpy arrays (if not already). lons = np.asarray(lons) lats = np.asarray(lats) if len(lons) != len(lats): raise ValueError( "'lons' and 'lats' must be of equal length ({} != {})".format( len(lons), len(lats) ) ) elif np.isscalar(lons) and np.isscalar(lats): # Both are scalars. Convert to arrays with one element. lons = np.atleast_1d(lons) lats = np.atleast_1d(lats) else: raise ValueError( "Both 'lats' and 'lons' must both be a sequence or both a scalar" ) num_points = len(lons) # If caller provided plate IDs. if plate_id is not None: # If plate ID is a scalar then all points have the same plate ID. if np.isscalar(plate_id): point_plate_ids = np.full(num_points, plate_id) else: point_plate_ids = np.asarray(plate_id) if len(point_plate_ids) != num_points: raise ValueError( "'plate_id' must be same length as 'lons' and 'lats' ({} != {})".format( len(point_plate_ids), num_points ) ) # If caller provided begin ages. if age is not None: # If age is a scalar then all points have the same age. if np.isscalar(age): point_ages = np.full(num_points, age) else: point_ages = np.asarray(age) if len(point_ages) != num_points: raise ValueError( "'age' must be same length as 'lons' and 'lats' ({} != {})".format( len(point_ages), num_points ) ) # Create pygplates points. points = [pygplates.PointOnSphere(lat, lon) for lon, lat in zip(lons, lats)] # If plate IDs and/or ages are automatically assigned using reconstructed static polygons then # some points might be outside all reconstructed static polygons, and hence not reconstructable. # # However, if the user provided both plate IDs and ages then all points will be reconstructable. points_are_reconstructable = np.full(num_points, True) # If caller did not provide plate IDs or begin ages then # we need to determine them using the static polygons. if plate_id is None or age is None: if plate_id is None: point_plate_ids = np.empty(num_points, dtype=int) if age is None: point_ages = np.empty(num_points) # Assign a plate ID to each point based on which reconstructed static polygon it's inside. static_polygons_snapshot = plate_reconstruction.static_polygons_snapshot( time, anchor_plate_id=anchor_plate_id, ) reconstructed_static_polygons_containing_points = ( static_polygons_snapshot.get_point_locations(points) ) for point_index in range(num_points): reconstructed_static_polygon = ( reconstructed_static_polygons_containing_points[point_index] ) # If current point is inside a reconstructed static polygon then assign its plate ID to the point, # otherwise assign the anchor plate to the point. if reconstructed_static_polygon is not None: reconstructed_static_polygon_feature = ( reconstructed_static_polygon.get_feature() ) if plate_id is None: point_plate_ids[point_index] = ( reconstructed_static_polygon_feature.get_reconstruction_plate_id() ) if age is None: point_ages[point_index], _ = ( reconstructed_static_polygon_feature.get_valid_time() ) else: # current point did NOT intersect a reconstructed static polygon ... # We're trying to assign a plate ID or assign an age (or both), neither of which we can assign. # That essentially makes the current point unreconstructable. # # Mark the current point as unreconstructable. points_are_reconstructable[point_index] = False if plate_id is None: # Assign the anchor plate ID to indicate we could NOT assign a proper plate ID. point_plate_ids[point_index] = anchor_plate_id if age is None: # Assign the distant future (not distant past) to indicate we could NOT assign a proper age. point_ages[point_index] = -np.inf # distant future # If point ages were explicitly provided by the caller then we need to check if points existed at 'time'. if age is not None: # Any point with an age younger than 'time' did not exist at 'time' and hence is not reconstructable. points_are_reconstructable[point_ages < time] = False # If requested, remove any unreconstructable points. if remove_unreconstructable_points and not points_are_reconstructable.all(): if unreconstructable_point_indices_list is not None: # Caller requested the indices of points that are NOT reconstructable. unreconstructable_point_indices_list.extend( np.where(points_are_reconstructable == False)[0] ) lons = lons[points_are_reconstructable] lats = lats[points_are_reconstructable] point_plate_ids = point_plate_ids[points_are_reconstructable] point_ages = point_ages[points_are_reconstructable] points = [ points[point_index] for point_index in range(num_points) if points_are_reconstructable[point_index] ] num_points = len(points) # All points are now reconstructable. points_are_reconstructable = np.full(num_points, True) # Create a feature for each point. # # Each feature has a point, a plate ID and a valid time range. # # Note: The valid time range always includes present day. point_features = [] for point_index in range(num_points): point_feature = pygplates.Feature() # Set the geometry. point_feature.set_geometry(points[point_index]) # Set the plate ID. point_feature.set_reconstruction_plate_id(point_plate_ids[point_index]) # Set the begin/end time. point_feature.set_valid_time( point_ages[point_index], # begin (age) -np.inf, # end (distant future; could also be zero for present day) ) point_features.append(point_feature) # If the points represent a snapshot at a *past* geological time then we need to reverse reconstruct them # such that their features contain present-day points. if time != 0: pygplates.reverse_reconstruct( point_features, plate_reconstruction.rotation_model, time, anchor_plate_id=anchor_plate_id, ) # Map each unique plate ID to indices of points assigned that plate ID. unique_plate_id_groups = {} unique_plate_ids = np.unique(point_plate_ids) for unique_plate_id in unique_plate_ids: # Determine which points have the current unique plate ID. unique_plate_id_point_indices = np.where( point_plate_ids == unique_plate_id )[ 0 ] # convert 1-tuple of 1D array to 1D array unique_plate_id_groups[unique_plate_id] = unique_plate_id_point_indices # # Assign data members. # # Note: These are documented attributes (in class docstring). # And they cannot be changed later (they are properties with no setter). # The other attributes probably should be readonly too (but at least they're not documented). self._plate_reconstruction = plate_reconstruction self._lons = lons self._lats = lats self._time = time self._plate_id = point_plate_ids self._age = point_ages self._anchor_plate_id = anchor_plate_id # get Cartesian coordinates self.x, self.y, self.z = _tools.lonlat2xyz(lons, lats, degrees=False) # scale by average radius of the Earth self.x *= _tools.EARTH_RADIUS self.y *= _tools.EARTH_RADIUS self.z *= _tools.EARTH_RADIUS # store concatenated arrays self.lonlat = np.c_[lons, lats] self.xyz = np.c_[self.x, self.y, self.z] self.points = points self.attributes = dict() self._reconstructable = points_are_reconstructable self._unique_plate_id_groups = unique_plate_id_groups self.features = point_features self.feature_collection = pygplates.FeatureCollection(point_features) def __getstate__(self): state = self.__dict__.copy() # Remove the unpicklable entries. # # This includes pygplates reconstructed feature geometries and resolved topological geometries. # Note: PyGPlates features and features collections (and rotation models) can be pickled though. # return state def __setstate__(self, state): self.__dict__.update(state) # Restore the unpicklable entries. # # This includes pygplates reconstructed feature geometries and resolved topological geometries. # Note: PyGPlates features and features collections (and rotation models) can be pickled though. # @property def plate_reconstruction(self): # Note: This is documented as an attribute in the class docstring. return self._plate_reconstruction @property def lons(self): # Note: This is documented as an attribute in the class docstring. return self._lons @property def lats(self): # Note: This is documented as an attribute in the class docstring. return self._lats @property def plate_id(self): # Note: This is documented as an attribute in the class docstring. return self._plate_id @property def age(self): # Note: This is documented as an attribute in the class docstring. return self._age @property def size(self): # Note: This is documented as an attribute in the class docstring. return len(self.points) @property def time(self): # Note: This is documented as an attribute in the class docstring. return self._time @property def anchor_plate_id(self): # Note: This is documented as an attribute in the class docstring. return self._anchor_plate_id @staticmethod def _check_anchor_plate_id(id): id = int(id) if id < 0: raise ValueError("Invalid anchor plate ID: {}".format(id)) return id def copy(self): """Returns a copy of the Points object Returns ------- Points A copy of the current Points object """ gpts = Points( self.plate_reconstruction, self.lons.copy(), self.lats.copy(), self.time, self.plate_id.copy(), self.age.copy(), anchor_plate_id=self.anchor_plate_id, ) gpts.add_attributes(**self.attributes.copy()) def add_attributes(self, **kwargs): """Adds the value of a feature attribute associated with a key. Example ------- # Define latitudes and longitudes to set up a Points object pt_lons = np.array([140., 150., 160.]) pt_lats = np.array([-30., -40., -50.]) gpts = gplately.Points(model, pt_lons, pt_lats) # Add the attributes a, b and c to the points in the Points object gpts.add_attributes( a=[10,2,2], b=[2,3,3], c=[30,0,0], ) print(gpts.attributes) The output would be: {'a': [10, 2, 2], 'b': [2, 3, 3], 'c': [30, 0, 0]} Parameters ---------- **kwargs : sequence of key=item/s A single key=value pair, or a sequence of key=value pairs denoting the name and value of an attribute. Notes ----- * An **assertion** is raised if the number of points in the Points object is not equal to the number of values associated with an attribute key. For example, consider an instance of the Points object with 3 points. If the points are ascribed an attribute `temperature`, there must be one `temperature` value per point, i.e. `temperature = [20, 15, 17.5]`. """ keys = kwargs.keys() for key in kwargs: attribute = kwargs[key] # make sure attribute is the same size as self.lons if type(attribute) is int or type(attribute) is float: array = np.full(self.lons.size, attribute) attribute = array elif isinstance(attribute, np.ndarray): if attribute.size == 1: array = np.full(self.lons.size, attribute, dtype=attribute.dtype) attribute = array assert ( len(attribute) == self.lons.size ), "Size mismatch, ensure attributes have the same number of entries as Points" self.attributes[key] = attribute if any(kwargs): # add these to the FeatureCollection for f, feature in enumerate(self.feature_collection): for key in keys: # extract value for each row in attribute val = self.attributes[key][f] # set this attribute on the feature feature.set_shapefile_attribute(key, val) def get_geopandas_dataframe(self): """Adds a shapely point `geometry` attribute to each point in the `gplately.Points` object. pandas.DataFrame that has a column with geometry Any existing point attributes are kept. Returns ------- GeoDataFrame : instance of `geopandas.GeoDataFrame` A pandas.DataFrame with rows equal to the number of points in the `gplately.Points` object, and an additional column containing a shapely `geometry` attribute. Example ------- pt_lons = np.array([140., 150., 160.]) pt_lats = np.array([-30., -40., -50.]) gpts = gplately.Points(model, pt_lons, pt_lats) # Add sample attributes a, b and c to the points in the Points object gpts.add_attributes( a=[10,2,2], b=[2,3,3], c=[30,0,0], ) gpts.get_geopandas_dataframe() ...has the output: a b c geometry 0 10 2 30 POINT (140.00000 -30.00000) 1 2 3 0 POINT (150.00000 -40.00000) 2 2 3 0 POINT (160.00000 -50.00000) """ import geopandas as gpd from shapely import geometry # create shapely points points = [] for lon, lat in zip(self.lons, self.lats): points.append(geometry.Point(lon, lat)) attributes = self.attributes.copy() attributes["geometry"] = points return gpd.GeoDataFrame(attributes, geometry="geometry") def get_geodataframe(self): """Returns the output of `Points.get_geopandas_dataframe()`. Adds a shapely point `geometry` attribute to each point in the `gplately.Points` object. pandas.DataFrame that has a column with geometry Any existing point attributes are kept. Returns ------- GeoDataFrame : instance of `geopandas.GeoDataFrame` A pandas.DataFrame with rows equal to the number of points in the `gplately.Points` object, and an additional column containing a shapely `geometry` attribute. Example ------- pt_lons = np.array([140., 150., 160.]) pt_lats = np.array([-30., -40., -50.]) gpts = gplately.Points(model, pt_lons, pt_lats) # Add sample attributes a, b and c to the points in the Points object gpts.add_attributes( a=[10,2,2], b=[2,3,3], c=[30,0,0], ) gpts.get_geopandas_dataframe() ...has the output: a b c geometry 0 10 2 30 POINT (140.00000 -30.00000) 1 2 3 0 POINT (150.00000 -40.00000) 2 2 3 0 POINT (160.00000 -50.00000) """ return self.get_geopandas_dataframe() def reconstruct( self, time, anchor_plate_id=None, return_array=False, return_point_indices=False ): """Reconstructs points supplied to this `Points` object from the supplied initial time (`self.time`) to the specified time (`time`). Only those points that are reconstructable (see `Points`) and that have ages greater than or equal to `time` (ie, at points that exist at `time`) are reconstructed. Parameters ---------- time : float The specific geological time (Ma) to reconstruct features to. anchor_plate_id : int, optional Reconstruct features with respect to a certain anchor plate. By default, reconstructions are made with respect to `self.anchor_plate_id` (which is the anchor plate that the initial points at the initial time are relative to). return_array : bool, default=False Return a 2-tuple of `numpy.ndarray`, rather than a `Points` object. return_point_indices : bool, default=False Return the indices of the points that are reconstructed. Those points with an age less than `time` have not yet appeared at `time`, and therefore are not reconstructed. These are indices into `self.lons`, `self.lats`, `self.plate_id` and `self.age`. Returns ------- reconstructed_points : Points Only provided if `return_array` is False. The reconstructed points in a `Points` object. rlons, rlats : ndarray Only provided if `return_array` is True. The longitude and latitude coordinate arrays of the reconstructed points. point_indices : ndarray Only provided if `return_point_indices` is True. The indices of the returned points (that are reconstructed). This array is the same size as `rlons` and `rlats` (or size of `reconstructed_points`). These are indices into `self.lons`, `self.lats`, `self.plate_id` and `self.age`. """ if anchor_plate_id is None: anchor_plate_id = self.anchor_plate_id # Start with an empty array. lat_lon_points = np.empty((self.size, 2)) # Determine which points are valid. # # These are those points that are reconstructable and have appeared before (or at) 'time' # (ie, have a time-of-appearance that's greater than or equal to 'time'). valid_mask = self._reconstructable & (self.age >= time) # Iterate over groups of points with the same plate ID. for ( plate_id, point_indices_with_plate_id, ) in self._unique_plate_id_groups.items(): # Determine which points (indices) with the current unique plate ID are valid. point_indices_with_plate_id = point_indices_with_plate_id[ valid_mask[point_indices_with_plate_id] ] # If none of the points (with the current unique plate ID) are valid then skip to next unique plate ID. if point_indices_with_plate_id.size == 0: continue # Get the reconstructed points with the current unique plate ID that have appeared before (or at) 'time'. reconstructed_points_with_plate_id = pygplates.MultiPointOnSphere( self.points[point_index] for point_index in point_indices_with_plate_id ) # First reconstruct the internal points from the initial time ('self.time') to present day using # our internal anchor plate ID (the same anchor plate used in '__init__'). # Then reconstruct from present day to 'time' using the *requested* anchor plate ID. # # Note 'self.points' (and hence 'reconstructed_points_with_plate_id') are the locations at 'self.time' # (just like 'self.lons' and 'self.lats'). reconstruct_rotation = ( self.plate_reconstruction.rotation_model.get_rotation( to_time=time, moving_plate_id=plate_id, from_time=0, anchor_plate_id=anchor_plate_id, ) * self.plate_reconstruction.rotation_model.get_rotation( to_time=0, moving_plate_id=plate_id, from_time=self.time, anchor_plate_id=self.anchor_plate_id, ) ) reconstructed_points_with_plate_id = ( reconstruct_rotation * reconstructed_points_with_plate_id ) # Write the reconstructed points. lat_lon_points[point_indices_with_plate_id] = [ rpoint.to_lat_lon() for rpoint in reconstructed_points_with_plate_id ] rlonslats = lat_lon_points[valid_mask] # remove invalid points rlons = rlonslats[:, 1] rlats = rlonslats[:, 0] return_tuple = () if return_array: return_tuple += rlons, rlats else: reconstructed_points = Points( self.plate_reconstruction, rlons, rlats, time=time, plate_id=self.plate_id[valid_mask], # remove invalid points age=self.age[valid_mask], # remove invalid points anchor_plate_id=anchor_plate_id, ) reconstructed_points.add_attributes(**self.attributes.copy()) return_tuple += (reconstructed_points,) if return_point_indices: all_point_indices = np.arange(self.size, dtype=int) point_indices = all_point_indices[valid_mask] # remove invalid points return_tuple += (point_indices,) # Return tuple of objects (unless only a single object, eg, just a 'Points' object). if len(return_tuple) == 1: return return_tuple[0] else: return return_tuple def reconstruct_to_birth_age( self, ages, anchor_plate_id=None, return_point_indices=False ): """Reconstructs points supplied to this `Points` object from the supplied initial time (`self.time`) to a range of times. The number of supplied times must equal the number of points supplied to this `Points` object (ie, 'self.size' attribute). Only those points that are reconstructable (see `Points`) and that have ages greater than or equal to the respective supplied ages (ie, at points that exist at the supplied ages) are reconstructed. Parameters ---------- ages : array Geological times to reconstruct points to. Must have the same length as the number of points (`self.size` attribute). anchor_plate_id : int, optional Reconstruct points with respect to a certain anchor plate. By default, reconstructions are made with respect to `self.anchor_plate_id` (which is the anchor plate that the initial points at the initial time are relative to). return_point_indices : bool, default=False Return the indices of the points that are reconstructed. Those points with an age less than their respective supplied age have not yet appeared, and therefore are not reconstructed. These are indices into `self.lons`, `self.lats`, `self.plate_id` and `self.age`. Raises ------ ValueError If the number of ages is not equal to the number of points supplied to this `Points` object. Returns ------- rlons, rlats : ndarray The longitude and latitude coordinate arrays of points reconstructed to the specified ages. point_indices : ndarray Only provided if `return_point_indices` is True. The indices of the returned points (that are reconstructed). This array is the same size as `rlons` and `rlats`. These are indices into `self.lons`, `self.lats`, `self.plate_id` and `self.age`. Examples -------- To reconstruct n seed points' locations to B Ma (for this example n=2, with (lon,lat) = (78,30) and (56,22) at time=0 Ma, and we reconstruct to B=10 Ma): # Longitude and latitude of n=2 seed points pt_lon = np.array([78., 56]) pt_lat = np.array([30., 22]) # Call the Points object! gpts = gplately.Points(model, pt_lon, pt_lat) print(gpts.features[0].get_all_geometries()) # Confirms we have features represented as points on a sphere ages = numpy.linspace(10,10, len(pt_lon)) rlons, rlats = gpts.reconstruct_to_birth_age(ages) """ if anchor_plate_id is None: anchor_plate_id = self.anchor_plate_id # Call it 'reconstruct_ages' to avoid confusion with 'self.age' (which is time-of-appearance of points). reconstruct_ages = np.asarray(ages) if len(reconstruct_ages) != self.size: raise ValueError( "'ages' must be same length as number of points ({} != {})".format( len(reconstruct_ages), self.size ) ) # Start with an empty array. lat_lon_points = np.empty((self.size, 2)) # Determine which points are valid. # # These are those points that are reconstructable and have appeared before (or at) their respective reconstruct ages # (ie, have a time-of-appearance that's greater than or equal to the respective reconstruct age). valid_mask = self._reconstructable & (self.age >= reconstruct_ages) # Iterate over groups of points with the same plate ID. for ( plate_id, point_indices_with_plate_id, ) in self._unique_plate_id_groups.items(): # Determine which points (indices) with the current unique plate ID are valid. point_indices_with_plate_id = point_indices_with_plate_id[ valid_mask[point_indices_with_plate_id] ] # If none of the points (with the current unique plate ID) are valid then skip to next unique plate ID. if point_indices_with_plate_id.size == 0: continue # Get all the unique reconstruct ages of all valid points with the current unique plate ID. point_reconstruct_ages_with_plate_id = reconstruct_ages[ point_indices_with_plate_id ] unique_reconstruct_ages_with_plate_id = np.unique( point_reconstruct_ages_with_plate_id ) for reconstruct_age in unique_reconstruct_ages_with_plate_id: # Indices of points with the current unique plate ID and the current unique reconstruct age. point_indices_with_plate_id_and_reconstruct_age = ( point_indices_with_plate_id[ point_reconstruct_ages_with_plate_id == reconstruct_age ] ) # Get the reconstructed points with the current unique plate ID and unique reconstruct age # (that exist at their respective reconstruct age). reconstructed_points_with_plate_id_and_reconstruct_age = pygplates.MultiPointOnSphere( self.points[point_index] for point_index in point_indices_with_plate_id_and_reconstruct_age ) # First reconstruct the internal points from the initial time ('self.time') to present day using # our internal anchor plate ID (the same anchor plate used in '__init__'). # Then reconstruct from present day to 'reconstruct_age' using the *requested* anchor plate ID. # # Note 'self.points' (and hence 'reconstructed_points_with_plate_id_and_reconstruct_age') are the locations at 'self.time' # (just like 'self.lons' and 'self.lats'). reconstruct_rotation = ( self.plate_reconstruction.rotation_model.get_rotation( to_time=reconstruct_age, moving_plate_id=plate_id, from_time=0, anchor_plate_id=anchor_plate_id, ) * self.plate_reconstruction.rotation_model.get_rotation( to_time=0, moving_plate_id=plate_id, from_time=self.time, anchor_plate_id=self.anchor_plate_id, ) ) reconstructed_points_with_plate_id_and_reconstruct_age = ( reconstruct_rotation * reconstructed_points_with_plate_id_and_reconstruct_age ) # Write the reconstructed points. lat_lon_points[point_indices_with_plate_id_and_reconstruct_age] = [ rpoint.to_lat_lon() for rpoint in reconstructed_points_with_plate_id_and_reconstruct_age ] rlonslats = lat_lon_points[valid_mask] # remove invalid points rlons = rlonslats[:, 1] rlats = rlonslats[:, 0] return_tuple = (rlons, rlats) if return_point_indices: all_point_indices = np.arange(self.size, dtype=int) point_indices = all_point_indices[valid_mask] # remove invalid points return_tuple += (point_indices,) return return_tuple def plate_velocity( self, time, delta_time=1.0, *, velocity_delta_time_type=pygplates.VelocityDeltaTimeType.t_plus_delta_t_to_t, velocity_units=pygplates.VelocityUnits.cms_per_yr, earth_radius_in_kms=pygplates.Earth.mean_radius_in_kms, anchor_plate_id=None, return_reconstructed_points=False, return_point_indices=False, ): """Calculates the east and north components of the tectonic plate velocities of the internal points at a particular geological time. The point velocities are calculated using the plate IDs of the internal points and the rotation model of the internal `PlateReconstruction` object. If the requested `time` differs from the initial time (`self.time`) then the internal points are first reconstructed to `time` before calculating velocities. Velocities are only calculated at points that are reconstructable (see `Points`) and that have ages greater than or equal to `time` (ie, at points that exist at `time`). Parameters ---------- time : float The specific geological time (Ma) at which to calculate plate velocities. delta_time : float, default=1.0 The time interval used for velocity calculations. 1.0Ma by default. velocity_delta_time_type : {pygplates.VelocityDeltaTimeType.t_plus_delta_t_to_t, pygplates.VelocityDeltaTimeType.t_to_t_minus_delta_t, pygplates.VelocityDeltaTimeType.t_plus_minus_half_delta_t}, default=pygplates.VelocityDeltaTimeType.t_plus_delta_t_to_t How the two velocity times are calculated relative to `time` (defaults to ``[time + velocity_delta_time, time]``). velocity_units : {pygplates.VelocityUnits.cms_per_yr, pygplates.VelocityUnits.kms_per_my}, default=pygplates.VelocityUnits.cms_per_yr Whether to return velocities in centimetres per year or kilometres per million years (defaults to centimetres per year). earth_radius_in_kms : float, default=pygplates.Earth.mean_radius_in_kms Radius of the Earth in kilometres. This is only used to calculate velocities (strain rates always use ``pygplates.Earth.equatorial_radius_in_kms``). anchor_plate_id : int, optional Anchor plate used to reconstruct the points and calculate velocities at their locations. By default, reconstructions are made with respect to `self.anchor_plate_id` (which is the anchor plate that the initial points at the initial time are relative to). return_reconstructed_points : bool, default=False Return the reconstructed points (as longitude and latitude arrays) in addition to the velocities. return_point_indices : bool, default=False Return the indices of those internal points at which velocities are calculated. These are indices into `self.lons`, `self.lats`, `self.plate_id` and `self.age`. Those points with an age less than `time` have not yet appeared at `time`, and therefore will not have velocities returned. Returns ------- velocity_lons, velocity_lats : ndarray The velocity arrays containing the *east* (longitude) and *north* (latitude) components of the velocity of each internal point that exists at `time` (ie, whose age greater than or equal to `time`). rlons, rlats : ndarray Only provided if `return_reconstructed_points` is True. The longitude and latitude coordinate arrays of the reconstructed points (at which velocities are calculated). These arrays are the same size as `velocity_lons` and `velocity_lats`. point_indices : ndarray Only provided if `return_point_indices` is True. The indices of the returned points (at which velocities are calculated). These are indices into `self.lons`, `self.lats`, `self.plate_id` and `self.age`. This array is the same size as `velocity_lons` and `velocity_lats`. Notes ----- The velocities are in *centimetres per year* by default (not *kilometres per million years*, the default in `PlateReconstruction.get_point_velocities`). This difference is maintained for backward compatibility. For each velocity, the *east* component is first followed by the *north* component. This is different to `PlateReconstruction.get_point_velocities` where the *north* component is first. This difference is maintained for backward compatibility. See Also -------- PlateReconstruction.get_point_velocities : Velocities of points calculated using topologies instead of plate IDs (assigned from static polygons). """ if anchor_plate_id is None: anchor_plate_id = self.anchor_plate_id # Start with empty arrays. north_east_velocities = np.empty((self.size, 2)) if return_reconstructed_points: lat_lon_points = np.empty((self.size, 2)) # Determine time interval for velocity calculation. if ( velocity_delta_time_type == pygplates.VelocityDeltaTimeType.t_plus_delta_t_to_t ): from_time = time + delta_time to_time = time elif ( velocity_delta_time_type == pygplates.VelocityDeltaTimeType.t_to_t_minus_delta_t ): from_time = time to_time = time - delta_time elif ( velocity_delta_time_type == pygplates.VelocityDeltaTimeType.t_plus_minus_half_delta_t ): from_time = time + delta_time / 2 to_time = time - delta_time / 2 else: raise ValueError( "'velocity_delta_time_type' value not one of pygplates.VelocityDeltaTimeType enumerated values" ) # Make sure time interval is non-negative. if to_time < 0: from_time -= to_time to_time = 0 # Determine which points are valid. # # These are those points that are reconstructable and have appeared before (or at) 'time' # (ie, have a time-of-appearance that's greater than or equal to 'time'). valid_mask = self._reconstructable & (self.age >= time) # Iterate over groups of points with the same plate ID. for ( plate_id, point_indices_with_plate_id, ) in self._unique_plate_id_groups.items(): # Determine which points (indices) with the current unique plate ID are valid. point_indices_with_plate_id = point_indices_with_plate_id[ valid_mask[point_indices_with_plate_id] ] # If none of the points (with the current unique plate ID) are valid then skip to next unique plate ID. if point_indices_with_plate_id.size == 0: continue # Get the reconstructed points with the current unique plate ID that have appeared before (or at) 'time'. reconstructed_points_with_plate_id = pygplates.MultiPointOnSphere( self.points[point_index] for point_index in point_indices_with_plate_id ) # Stage rotation for the current unique plate ID. velocity_equivalent_stage_rotation = ( self.plate_reconstruction.rotation_model.get_rotation( to_time, plate_id, from_time, anchor_plate_id=anchor_plate_id ) ) # First reconstruct the internal points from the initial time ('self.time') to present day using # our internal anchor plate ID (the same anchor plate used in '__init__'). # Then reconstruct from present day to 'time' using the *requested* anchor plate ID. # # Note 'self.points' (and hence 'reconstructed_points_with_plate_id') are the locations at 'self.time' # (just like 'self.lons' and 'self.lats'). reconstruct_rotation = ( self.plate_reconstruction.rotation_model.get_rotation( to_time=time, moving_plate_id=plate_id, from_time=0, anchor_plate_id=anchor_plate_id, ) * self.plate_reconstruction.rotation_model.get_rotation( to_time=0, moving_plate_id=plate_id, from_time=self.time, anchor_plate_id=self.anchor_plate_id, ) ) reconstructed_points_with_plate_id = ( reconstruct_rotation * reconstructed_points_with_plate_id ) velocity_vectors_with_plate_id = pygplates.calculate_velocities( reconstructed_points_with_plate_id, velocity_equivalent_stage_rotation, delta_time, velocity_units=velocity_units, earth_radius_in_kms=earth_radius_in_kms, ) north_east_down_velocities_with_plate_id = ( pygplates.LocalCartesian.convert_from_geocentric_to_north_east_down( reconstructed_points_with_plate_id, velocity_vectors_with_plate_id ) ) # Write velocities of points with the current unique plate ID as (north, east) components. north_east_velocities[point_indices_with_plate_id] = [ (ned.get_x(), ned.get_y()) # north, east for ned in north_east_down_velocities_with_plate_id ] # Also write the reconstructed points (if requested). if return_reconstructed_points: lat_lon_points[point_indices_with_plate_id] = [ rpoint.to_lat_lon() for rpoint in reconstructed_points_with_plate_id ] velocities = north_east_velocities[valid_mask] # remove invalid points velocity_lons = velocities[:, 1] # east velocity_lats = velocities[:, 0] # north return_tuple = velocity_lons, velocity_lats if return_reconstructed_points: rlonslats = lat_lon_points[valid_mask] # remove invalid points rlons = rlonslats[:, 1] rlats = rlonslats[:, 0] return_tuple += (rlons, rlats) if return_point_indices: all_point_indices = np.arange(self.size, dtype=int) point_indices = all_point_indices[valid_mask] # remove invalid points return_tuple += (point_indices,) return return_tuple def motion_path( self, time_array, anchor_plate_id=None, return_rate_of_motion=False ): """Create a path of points to mark the trajectory of a plate's motion through geological time. Parameters ---------- time_array : arr An array of reconstruction times at which to determine the trajectory of a point on a plate. For example: import numpy as np min_time = 30 max_time = 100 time_step = 2.5 time_array = np.arange(min_time, max_time + time_step, time_step) anchor_plate_id : int, optional Reconstruct features with respect to a certain anchor plate. By default, reconstructions are made with respect to the anchor plate ID specified in the `gplately.PlateReconstruction` object. return_rate_of_motion : bool, default=False Choose whether to return the rate of plate motion through time for each Returns ------- rlons : ndarray An n-dimensional array with columns containing the longitudes of the seed points at each timestep in `time_array`. There are n columns for n seed points. rlats : ndarray An n-dimensional array with columns containing the latitudes of the seed points at each timestep in `time_array`. There are n columns for n seed points. """ time_array = np.atleast_1d(time_array) # ndarrays to fill with reconstructed points and # rates of motion (if requested) rlons = np.empty((len(time_array), len(self.lons))) rlats = np.empty((len(time_array), len(self.lons))) for i, point_feature in enumerate(self.feature_collection): # Create the motion path feature motion_path_feature = pygplates.Feature.create_motion_path( point_feature.get_geometry(), time_array.tolist(), valid_time=(time_array.max(), time_array.min()), relative_plate=int(self.plate_id[i]), reconstruction_plate_id=( anchor_plate_id # if None then uses default anchor plate of 'self.plate_reconstruction' if anchor_plate_id is not None else self.plate_reconstruction.anchor_plate_id ), ) reconstructed_motion_paths = self.plate_reconstruction.reconstruct( motion_path_feature, to_time=0, # from_time=0, reconstruct_type=pygplates.ReconstructType.motion_path, anchor_plate_id=anchor_plate_id, # if None then uses default anchor plate of 'self.plate_reconstruction' ) # Turn motion paths in to lat-lon coordinates for reconstructed_motion_path in reconstructed_motion_paths: trail = reconstructed_motion_path.get_motion_path().to_lat_lon_array() lon, lat = np.flipud(trail[:, 1]), np.flipud(trail[:, 0]) rlons[:, i] = lon rlats[:, i] = lat # Obtain step-plot coordinates for rate of motion if return_rate_of_motion is True: StepTimes = np.empty(((len(time_array) - 1) * 2, len(self.lons))) StepRates = np.empty(((len(time_array) - 1) * 2, len(self.lons))) # Get timestep TimeStep = [] for j in range(len(time_array) - 1): diff = time_array[j + 1] - time_array[j] TimeStep.append(diff) # Iterate over each segment in the reconstructed motion path, get the distance travelled by the moving # plate relative to the fixed plate in each time step Dist = [] for reconstructed_motion_path in reconstructed_motion_paths: for ( segment ) in reconstructed_motion_path.get_motion_path().get_segments(): Dist.append( segment.get_arc_length() * _tools.geocentric_radius( segment.get_start_point().to_lat_lon()[0] ) / 1e3 ) # Note that the motion path coordinates come out starting with the oldest time and working forwards # So, to match our 'times' array, we flip the order Dist = np.flipud(Dist) # Get rate of motion as distance per Myr Rate = np.asarray(Dist) / TimeStep # Manipulate arrays to get a step plot StepRate = np.zeros(len(Rate) * 2) StepRate[::2] = Rate StepRate[1::2] = Rate StepTime = np.zeros(len(Rate) * 2) StepTime[::2] = time_array[:-1] StepTime[1::2] = time_array[1:] # Append the nth point's step time and step rate coordinates to the ndarray StepTimes[:, i] = StepTime StepRates[:, i] = StepRate * 0.1 # cm/yr if return_rate_of_motion is True: return ( np.squeeze(rlons), np.squeeze(rlats), np.squeeze(StepTimes), np.squeeze(StepRates), ) else: return np.squeeze(rlons), np.squeeze(rlats) def flowline( self, time_array, left_plate_ID, right_plate_ID, return_rate_of_motion=False ): """Create a path of points to track plate motion away from spreading ridges over time using half-stage rotations. Parameters ---------- lons : arr An array of longitudes of points along spreading ridges. lats : arr An array of latitudes of points along spreading ridges. time_array : arr A list of times to obtain seed point locations at. left_plate_ID : int The plate ID of the polygon to the left of the spreading ridge. right_plate_ID : int The plate ID of the polygon to the right of the spreading ridge. return_rate_of_motion : bool, default False Choose whether to return a step time and step rate array for a step-plot of flowline motion. Returns ------- left_lon : ndarray The longitudes of the __left__ flowline for n seed points. There are n columns for n seed points, and m rows for m time steps in `time_array`. left_lat : ndarray The latitudes of the __left__ flowline of n seed points. There are n columns for n seed points, and m rows for m time steps in `time_array`. right_lon : ndarray The longitudes of the __right__ flowline of n seed points. There are n columns for n seed points, and m rows for m time steps in `time_array`. right_lat : ndarray The latitudes of the __right__ flowline of n seed points. There are n columns for n seed points, and m rows for m time steps in `time_array`. Examples -------- To access the ith seed point's left and right latitudes and longitudes: for i in np.arange(0,len(seed_points)): left_flowline_longitudes = left_lon[:,i] left_flowline_latitudes = left_lat[:,i] right_flowline_longitudes = right_lon[:,i] right_flowline_latitudes = right_lat[:,i] """ model = self.plate_reconstruction return model.create_flowline( self.lons, self.lats, time_array, left_plate_ID, right_plate_ID, return_rate_of_motion, ) def _get_dataframe(self): import geopandas as gpd data = dict() data["Longitude"] = self.lons data["Latitude"] = self.lats data["Plate_ID"] = self.plate_id for key in self.attributes: data[key] = self.attributes[key] return gpd.GeoDataFrame(data) def save(self, filename): """Saves the feature collection used in the Points object under a given filename to the current directory. The file format is determined from the filename extension. Parameters ---------- filename : string Can be provided as a string including the filename and the file format needed. Returns ------- Feature collection saved under given filename to current directory. """ filename = str(filename) if filename.endswith((".csv", ".txt", ".dat")): df = self._get_dataframe() df.to_csv(filename, index=False) elif filename.endswith((".xls", ".xlsx")): df = self._get_dataframe() df.to_excel(filename, index=False) elif filename.endswith("xml"): df = self._get_dataframe() df.to_xml(filename, index=False) elif ( filename.endswith(".gpml") or filename.endswith(".gpmlz") or filename.endswith(".shp") ): self.feature_collection.write(filename) else: raise ValueError( "Cannot save to specified file type. Use csv, gpml, shp or xls file extension." ) def rotate_reference_frames( self, reconstruction_time, from_rotation_features_or_model=None, # filename(s), or pyGPlates feature(s)/collection(s) or a RotationModel to_rotation_features_or_model=None, # filename(s), or pyGPlates feature(s)/collection(s) or a RotationModel from_rotation_reference_plate=0, to_rotation_reference_plate=0, non_reference_plate=701, output_name=None, return_array=False, ): """Rotate a grid defined in one plate model reference frame within a gplately.Raster object to another plate reconstruction model reference frame. Parameters ---------- reconstruction_time : float The time at which to rotate the reconstructed points. from_rotation_features_or_model : str/`os.PathLike`, list of str/`os.PathLike`, or instance of `pygplates.RotationModel` A filename, or a list of filenames, or a pyGPlates RotationModel object that defines the rotation model that the input grid is currently associated with. `self.plate_reconstruction.rotation_model` is default. to_rotation_features_or_model : str/`os.PathLike`, list of str/`os.PathLike`, or instance of `pygplates.RotationModel` A filename, or a list of filenames, or a pyGPlates RotationModel object that defines the rotation model that the input grid shall be rotated with. `self.plate_reconstruction.rotation_model` is default. from_rotation_reference_plate : int, default = 0 The current reference plate for the plate model the points are defined in. Defaults to the anchor plate 0. to_rotation_reference_plate : int, default = 0 The desired reference plate for the plate model the points to be rotated to. Defaults to the anchor plate 0. non_reference_plate : int, default = 701 An arbitrary placeholder reference frame with which to define the "from" and "to" reference frames. output_name : str, default None If passed, the rotated points are saved as a gpml to this filename. Returns ------- Points An instance of the `Points` object containing the rotated points. """ if output_name is not None: raise NotImplementedError("'output_name' parameter is not implemented") if from_rotation_features_or_model is None: from_rotation_features_or_model = self.plate_reconstruction.rotation_model if to_rotation_features_or_model is None: to_rotation_features_or_model = self.plate_reconstruction.rotation_model # Create the pygplates.FiniteRotation that rotates # between the two reference frames. from_rotation_model = pygplates.RotationModel(from_rotation_features_or_model) to_rotation_model = pygplates.RotationModel(to_rotation_features_or_model) from_rotation = from_rotation_model.get_rotation( reconstruction_time, non_reference_plate, anchor_plate_id=from_rotation_reference_plate, ) to_rotation = to_rotation_model.get_rotation( reconstruction_time, non_reference_plate, anchor_plate_id=to_rotation_reference_plate, ) reference_frame_conversion_rotation = to_rotation * from_rotation.get_inverse() # reconstruct points to reconstruction_time lons, lats = self.reconstruct( reconstruction_time, anchor_plate_id=from_rotation_reference_plate, return_array=True, ) # convert FeatureCollection to MultiPointOnSphere input_points = pygplates.MultiPointOnSphere( (lat, lon) for lon, lat in zip(lons, lats) ) # Rotate grid nodes to the other reference frame output_points = reference_frame_conversion_rotation * input_points # Assemble rotated points with grid values. out_lon = np.empty_like(self.lons) out_lat = np.empty_like(self.lats) for i, point in enumerate(output_points): out_lat[i], out_lon[i] = point.to_lat_lon() if return_array: return out_lon, out_lat else: return Points( self.plate_reconstruction, out_lon, out_lat, time=reconstruction_time, plate_id=self.plate_id.copy(), age=self.age.copy(), anchor_plate_id=to_rotation_reference_plate, )Instance variables
prop age-
Expand source code
@property
def age(self):
    # Note: This is documented as an attribute in the class docstring.
    return self._age
prop anchor_plate_id-
Expand source code
@property
def anchor_plate_id(self):
    # Note: This is documented as an attribute in the class docstring.
    return self._anchor_plate_id
prop lats-
Expand source code
@property
def lats(self):
    # Note: This is documented as an attribute in the class docstring.
    return self._lats
prop lons-
Expand source code
@property
def lons(self):
    # Note: This is documented as an attribute in the class docstring.
    return self._lons
prop plate_id-
Expand source code
@property
def plate_id(self):
    # Note: This is documented as an attribute in the class docstring.
    return self._plate_id
prop plate_reconstruction-
Expand source code
@property
def plate_reconstruction(self):
    # Note: This is documented as an attribute in the class docstring.
    return self._plate_reconstruction
prop size-
Expand source code
@property
def size(self):
    # Note: This is documented as an attribute in the class docstring.
    return len(self.points)
prop time-
Expand source code
@property
def time(self):
    # Note: This is documented as an attribute in the class docstring.
    return self._time
Methods
def add_attributes(self, **kwargs)-
Adds the value of a feature attribute associated with a key.
Example
# Define latitudes and longitudes to set up a Points object
pt_lons = np.array([140., 150., 160.])
pt_lats = np.array([-30., -40., -50.])

gpts = gplately.Points(model, pt_lons, pt_lats)

# Add the attributes a, b and c to the points in the Points object
gpts.add_attributes(
    a=[10,2,2],
    b=[2,3,3],
    c=[30,0,0],
)

print(gpts.attributes)
The output would be:
{'a': [10, 2, 2], 'b': [2, 3, 3], 'c': [30, 0, 0]}Parameters
**kwargs:sequenceofkey=item/s- A single key=value pair, or a sequence of key=value pairs denoting the name and value of an attribute.
Notes
- An assertion is raised if the number of points in the Points object is not equal
to the number of values associated with an attribute key. For example, consider an instance
of the Points object with 3 points. If the points are ascribed an attribute
temperature, there must be onetemperaturevalue per point, i.e.temperature = [20, 15, 17.5].
def copy(self)def flowline(self, time_array, left_plate_ID, right_plate_ID, return_rate_of_motion=False)-
Create a path of points to track plate motion away from spreading ridges over time using half-stage rotations.
Parameters
lons:arr- An array of longitudes of points along spreading ridges.
lats:arr- An array of latitudes of points along spreading ridges.
time_array:arr- A list of times to obtain seed point locations at.
left_plate_ID:int- The plate ID of the polygon to the left of the spreading ridge.
right_plate_ID:int- The plate ID of the polygon to the right of the spreading ridge.
return_rate_of_motion:bool, defaultFalse- Choose whether to return a step time and step rate array for a step-plot of flowline motion.
Returns
left_lon:ndarray- The longitudes of the left flowline for n seed points.
There are n columns for n seed points, and m rows
for m time steps in
time_array. left_lat:ndarray- The latitudes of the left flowline of n seed points.
There are n columns for n seed points, and m rows
for m time steps in
time_array. right_lon:ndarray- The longitudes of the right flowline of n seed points.
There are n columns for n seed points, and m rows
for m time steps in
time_array. right_lat:ndarray- The latitudes of the right flowline of n seed points.
There are n columns for n seed points, and m rows
for m time steps in
time_array.
Examples
To access the ith seed point's left and right latitudes and longitudes:
for i in np.arange(0,len(seed_points)):
    left_flowline_longitudes = left_lon[:,i]
    left_flowline_latitudes = left_lat[:,i]
    right_flowline_longitudes = right_lon[:,i]
    right_flowline_latitudes = right_lat[:,i]
def get_geodataframe(self)-
Returns the output of
Points.get_geopandas_dataframe().Adds a shapely point
gplately.geometryattribute to each point in thePointsobject. pandas.DataFrame that has a column with geometry Any existing point attributes are kept.Returns
GeoDataFrame:instanceofgeopandas.GeoDataFrame- A pandas.DataFrame with rows equal to the number of points in the
Pointsobject, and an additional column containing a shapelygplately.geometryattribute.
Example
pt_lons = np.array([140., 150., 160.])
pt_lats = np.array([-30., -40., -50.])

gpts = gplately.Points(model, pt_lons, pt_lats)

# Add sample attributes a, b and c to the points in the Points object
gpts.add_attributes(
    a=[10,2,2],
    b=[2,3,3],
    c=[30,0,0],
)

gpts.get_geopandas_dataframe()
…has the output:
    a  b   c                     geometry
0  10  2  30  POINT (140.00000 -30.00000)
1   2  3   0  POINT (150.00000 -40.00000)
2   2  3   0  POINT (160.00000 -50.00000)
def get_geopandas_dataframe(self)-
Adds a shapely point
gplately.geometryattribute to each point in thePointsobject. pandas.DataFrame that has a column with geometry Any existing point attributes are kept.Returns
GeoDataFrame:instanceofgeopandas.GeoDataFrame- A pandas.DataFrame with rows equal to the number of points in the
Pointsobject, and an additional column containing a shapelygplately.geometryattribute.
Example
pt_lons = np.array([140., 150., 160.])
pt_lats = np.array([-30., -40., -50.])

gpts = gplately.Points(model, pt_lons, pt_lats)

# Add sample attributes a, b and c to the points in the Points object
gpts.add_attributes(
    a=[10,2,2],
    b=[2,3,3],
    c=[30,0,0],
)

gpts.get_geopandas_dataframe()
…has the output:
    a  b   c                     geometry
0  10  2  30  POINT (140.00000 -30.00000)
1   2  3   0  POINT (150.00000 -40.00000)
2   2  3   0  POINT (160.00000 -50.00000)
def motion_path(self, time_array, anchor_plate_id=None, return_rate_of_motion=False)-
Create a path of points to mark the trajectory of a plate's motion through geological time.
Parameters
time_array:arr- An array of reconstruction times at which to determine the trajectory
of a point on a plate. For example:
import numpy as np min_time = 30 max_time = 100 time_step = 2.5 time_array = np.arange(min_time, max_time + time_step, time_step) anchor_plate_id:int, optional- Reconstruct features with respect to a certain anchor plate. By default, reconstructions are made
with respect to the anchor plate ID specified in the
PlateReconstructionobject. return_rate_of_motion:bool, default=False- Choose whether to return the rate of plate motion through time for each
Returns
rlons:ndarray- An n-dimensional array with columns containing the longitudes of
the seed points at each timestep in
time_array. There are n columns for n seed points. rlats:ndarray- An n-dimensional array with columns containing the latitudes of
the seed points at each timestep in
time_array. There are n columns for n seed points.
def plate_velocity(self, time, delta_time=1.0, *, velocity_delta_time_type=pygplates.pygplates.VelocityDeltaTimeType.t_plus_delta_t_to_t, velocity_units=pygplates.pygplates.VelocityUnits.cms_per_yr, earth_radius_in_kms=6371.009, anchor_plate_id=None, return_reconstructed_points=False, return_point_indices=False)-
Calculates the east and north components of the tectonic plate velocities of the internal points at a particular geological time.
The point velocities are calculated using the plate IDs of the internal points and the rotation model of the internal
PlateReconstructionobject. If the requestedtimediffers from the initial time (self.time) then the internal points are first reconstructed totimebefore calculating velocities. Velocities are only calculated at points that are reconstructable (seePoints) and that have ages greater than or equal totime(ie, at points that exist attime).Parameters
time:float- The specific geological time (Ma) at which to calculate plate velocities.
delta_time:float, default=1.0- The time interval used for velocity calculations. 1.0Ma by default.
velocity_delta_time_type:{pygplates.VelocityDeltaTimeType.t_plus_delta_t_to_t, pygplates.VelocityDeltaTimeType.t_to_t_minus_delta_t, pygplates.VelocityDeltaTimeType.t_plus_minus_half_delta_t}, default=pygplates.VelocityDeltaTimeType.t_plus_delta_t_to_t- How the two velocity times are calculated relative to
time(defaults to[time + velocity_delta_time, time]). velocity_units:{pygplates.VelocityUnits.cms_per_yr, pygplates.VelocityUnits.kms_per_my}, default=pygplates.VelocityUnits.cms_per_yr- Whether to return velocities in centimetres per year or kilometres per million years (defaults to centimetres per year).
earth_radius_in_kms:float, default=pygplates.Earth.mean_radius_in_kms- Radius of the Earth in kilometres.
This is only used to calculate velocities (strain rates always use
pygplates.Earth.equatorial_radius_in_kms). anchor_plate_id:int, optional- Anchor plate used to reconstruct the points and calculate velocities at their locations.
By default, reconstructions are made with respect to
self.anchor_plate_id(which is the anchor plate that the initial points at the initial time are relative to). return_reconstructed_points:bool, default=False- Return the reconstructed points (as longitude and latitude arrays) in addition to the velocities.
return_point_indices:bool, default=False- Return the indices of those internal points at which velocities are calculated.
These are indices into
self.lons,self.lats,self.plate_idandself.age. Those points with an age less thantimehave not yet appeared attime, and therefore will not have velocities returned.
Returns
velocity_lons,velocity_lats:ndarray- The velocity arrays containing the east (longitude) and north (latitude) components of the velocity of each internal point that exists at
time(ie, whose age greater than or equal totime). rlons,rlats:ndarray- Only provided if
return_reconstructed_pointsis True. The longitude and latitude coordinate arrays of the reconstructed points (at which velocities are calculated). These arrays are the same size asvelocity_lonsandvelocity_lats. point_indices:ndarray- Only provided if
return_point_indicesis True. The indices of the returned points (at which velocities are calculated). These are indices intoself.lons,self.lats,self.plate_idandself.age. This array is the same size asvelocity_lonsandvelocity_lats.
Notes
The velocities are in centimetres per year by default (not kilometres per million years, the default in
PlateReconstruction.get_point_velocities()). This difference is maintained for backward compatibility.For each velocity, the east component is first followed by the north component. This is different to
PlateReconstruction.get_point_velocities()where the north component is first. This difference is maintained for backward compatibility.See Also
PlateReconstruction.get_point_velocities()- Velocities of points calculated using topologies instead of plate IDs (assigned from static polygons).
def reconstruct(self, time, anchor_plate_id=None, return_array=False, return_point_indices=False)-
Reconstructs points supplied to this
Pointsobject from the supplied initial time (self.time) to the specified time (time).Only those points that are reconstructable (see
Points) and that have ages greater than or equal totime(ie, at points that exist attime) are reconstructed.Parameters
time:float- The specific geological time (Ma) to reconstruct features to.
anchor_plate_id:int, optional- Reconstruct features with respect to a certain anchor plate.
By default, reconstructions are made with respect to
self.anchor_plate_id(which is the anchor plate that the initial points at the initial time are relative to). return_array:bool, default=False- Return a 2-tuple of
numpy.ndarray, rather than aPointsobject. return_point_indices:bool, default=False- Return the indices of the points that are reconstructed.
Those points with an age less than
timehave not yet appeared attime, and therefore are not reconstructed. These are indices intoself.lons,self.lats,self.plate_idandself.age.
Returns
reconstructed_points:Points- Only provided if
return_arrayis False. The reconstructed points in aPointsobject. rlons,rlats:ndarray- Only provided if
return_arrayis True. The longitude and latitude coordinate arrays of the reconstructed points. point_indices:ndarray- Only provided if
return_point_indicesis True. The indices of the returned points (that are reconstructed). This array is the same size asrlonsandrlats(or size ofreconstructed_points). These are indices intoself.lons,self.lats,self.plate_idandself.age.
def reconstruct_to_birth_age(self, ages, anchor_plate_id=None, return_point_indices=False)-
Reconstructs points supplied to this
Pointsobject from the supplied initial time (self.time) to a range of times.The number of supplied times must equal the number of points supplied to this
Pointsobject (ie, 'self.size' attribute). Only those points that are reconstructable (seePoints) and that have ages greater than or equal to the respective supplied ages (ie, at points that exist at the supplied ages) are reconstructed.Parameters
ages:array- Geological times to reconstruct points to. Must have the same length as the number of points (
self.sizeattribute). anchor_plate_id:int, optional- Reconstruct points with respect to a certain anchor plate.
By default, reconstructions are made with respect to
self.anchor_plate_id(which is the anchor plate that the initial points at the initial time are relative to). return_point_indices:bool, default=False- Return the indices of the points that are reconstructed.
Those points with an age less than their respective supplied age have not yet appeared, and therefore are not reconstructed.
These are indices into
self.lons,self.lats,self.plate_idandself.age.
Raises
ValueError- If the number of ages is not equal to the number of points supplied to this
Pointsobject.
Returns
rlons,rlats:ndarray- The longitude and latitude coordinate arrays of points reconstructed to the specified ages.
point_indices:ndarray- Only provided if
return_point_indicesis True. The indices of the returned points (that are reconstructed). This array is the same size asrlonsandrlats. These are indices intoself.lons,self.lats,self.plate_idandself.age.
Examples
To reconstruct n seed points' locations to B Ma (for this example n=2, with (lon,lat) = (78,30) and (56,22) at time=0 Ma, and we reconstruct to B=10 Ma):
# Longitude and latitude of n=2 seed points
pt_lon = np.array([78., 56])
pt_lat = np.array([30., 22])

# Call the Points object!
gpts = gplately.Points(model, pt_lon, pt_lat)
print(gpts.features[0].get_all_geometries())   # Confirms we have features represented as points on a sphere

ages = numpy.linspace(10,10, len(pt_lon))
rlons, rlats = gpts.reconstruct_to_birth_age(ages)
def rotate_reference_frames(self, reconstruction_time, from_rotation_features_or_model=None, to_rotation_features_or_model=None, from_rotation_reference_plate=0, to_rotation_reference_plate=0, non_reference_plate=701, output_name=None, return_array=False)-
Rotate a grid defined in one plate model reference frame within a gplately.Raster object to another plate reconstruction model reference frame.
Parameters
reconstruction_time:float- The time at which to rotate the reconstructed points.
from_rotation_features_or_model:str/os.PathLike, listofstr/os.PathLike,orinstanceofpygplates.RotationModel- A filename, or a list of filenames, or a pyGPlates
RotationModel object that defines the rotation model
that the input grid is currently associated with.
self.plate_reconstruction.rotation_modelis default. to_rotation_features_or_model:str/os.PathLike, listofstr/os.PathLike,orinstanceofpygplates.RotationModel- A filename, or a list of filenames, or a pyGPlates
RotationModel object that defines the rotation model
that the input grid shall be rotated with.
self.plate_reconstruction.rotation_modelis default. from_rotation_reference_plate:int, default= 0- The current reference plate for the plate model the points are defined in. Defaults to the anchor plate 0.
to_rotation_reference_plate:int, default= 0- The desired reference plate for the plate model the points to be rotated to. Defaults to the anchor plate 0.
non_reference_plate:int, default= 701- An arbitrary placeholder reference frame with which to define the "from" and "to" reference frames.
output_name:str, defaultNone- If passed, the rotated points are saved as a gpml to this filename.
Returns
def save(self, filename)-
Saves the feature collection used in the Points object under a given filename to the current directory.
The file format is determined from the filename extension.
Parameters
filename:string- Can be provided as a string including the filename and the file format needed.
Returns
Feature collection saved under given filename to current directory.
class Raster (data=None, plate_reconstruction=None, extent='global', realign=False, resample=None, resize=None, time=0.0, origin=None, x_dimension_name: str = '', y_dimension_name: str = '', data_variable_name: str = '', **kwargs)-
The Raster class handles raster data.
Raster's functionalities include sampling data at points using spline interpolation, resampling rasters with new X and Y-direction spacings and resizing rasters using new X and Y grid pixel resolutions. NaN-type data in rasters can be replaced with the values of their nearest valid neighbours.Parameters
data:strorarray-like- The raster data, either as a filename (
str) or array. plate_reconstruction:PlateReconstruction- Allows for the accessibility of PlateReconstruction object attributes.
Namely, PlateReconstruction object attributes rotation_model,
topology_features and static_polygons can be used in the
Rasterobject if called using “self.plate_reconstruction.X”, where X is the attribute. extent:stror4-tuple, default: 'global'- 4-tuple to specify (min_lon, max_lon, min_lat, max_lat) extents
of the raster. If no extents are supplied, full global extent
[-180,180,-90,90] is assumed (equivalent to
extent='global'). For array data with an upper-left origin, make suremin_latis greater thanmax_lat, or specifyoriginparameter. resample:2-tuple, optional- Optionally resample grid, pass spacing in X and Y direction as a 2-tuple e.g. resample=(spacingX, spacingY).
time:float, default: 0.0- The time step represented by the raster data. Used for raster reconstruction.
origin:{'lower', 'upper'}, optional- When
datais an array, use this parameter to specify the origin (upper left or lower left) of the data (overridingextent). **kwargs- Handle deprecated arguments such as
PlateReconstruction_object,filename, andarray.
Attributes
data:ndarray, shape (ny, nx)- Array containing the underlying raster data. This attribute can be
modified after creation of the
Raster. plate_reconstruction:PlateReconstruction- An object of GPlately's
PlateReconstructionclass, like therotation_model, a set of reconstructabletopology_featuresandstatic_polygonsthat belong to a particular plate model. These attributes can be used in theRasterobject if called using “self.plate_reconstruction.X”, where X is the attribute. This attribute can be modified after creation of theRaster. extent:tupleoffloats- Four-element array to specify [min lon, max lon, min lat, max lat] extents of any sampling points. If no extents are supplied, full global extent [-180,180,-90,90] is assumed.
lons:ndarray, shape (nx,)- The x-coordinates of the raster data. This attribute can be modified
after creation of the
Raster. lats:ndarray, shape (ny,)- The y-coordinates of the raster data. This attribute can be modified
after creation of the
Raster. origin:{'lower', 'upper'}- The origin (lower or upper left) or the data array.
filename:strorNone- The filename used to create the
Rasterobject. If the object was created directly from an array, this attribute isNone.
Methods
interpolate(lons, lats, method='linear', return_indices=False) Sample gridded data at a set of points using spline interpolation.
resample(spacingX, spacingY, overwrite=False) Resamples the grid using X & Y-spaced lat-lon arrays, meshed with linear interpolation.
resize(resX, resY, overwrite=False) Resizes the grid with a specific resolution and samples points using linear interpolation.
fill_NaNs(overwrite=False) Searches for invalid 'data' cells containing NaN-type entries and replaces NaNs with the value of the nearest valid data cell.
reconstruct(time, fill_value=None, partitioning_features=None, threads=1, anchor_plate_id=None, inplace=False) Reconstruct the raster from its initial time (
self.time) to a new time.Constructs all necessary attributes for the raster object.
Note: either a str path to a netCDF file OR an ndarray representing a grid must be specified.
Parameters
data:strorarray-like- The raster data, either as a filename (
str) or array. plate_reconstruction:PlateReconstruction- Allows for the accessibility of PlateReconstruction object attributes. Namely, PlateReconstruction object attributes rotation_model, topology_featues and static_polygons can be used in the points object if called using “self.plate_reconstruction.X”, where X is the attribute.
extent:stror4-tuple, default: 'global'- 4-tuple to specify (min_lon, max_lon, min_lat, max_lat) extents
of the raster. If no extents are supplied, full global extent
[-180,180,-90,90] is assumed (equivalent to
extent='global'). For array data with an upper-left origin, make suremin_latis greater thanmax_lat, or specifyoriginparameter. resample:2-tuple, optional- Optionally resample grid, pass spacing in X and Y direction as a 2-tuple e.g. resample=(spacingX, spacingY).
resize:2-tuple, optional- Optionally resample grid to X-columns, Y-rows as a 2-tuple e.g. resample=(resX, resY).
time:float, default: 0.0- The time step represented by the raster data. Used for raster reconstruction.
origin:{'lower', 'upper'}, optional- When
datais an array, use this parameter to specify the origin (upper left or lower left) of the data (overridingextent). x_dimension_name:str, optional, default=""- If the grid file uses comman names, such as "x", "lon", "lons" or "longitude", you need not set this parameter. Otherwise, you need to tell us what the x dimension name is.
y_dimension_name:str, optional, default=""- If the grid file uses comman names, such as "y", "lat", "lats" or "latitude", you need not set this parameter. Otherwise, you need to tell us what the y dimension name is.
data_variable_name:str, optional, default=""- The program will try its best to determine the data variable name. However, it would be better if you could tell us what the data variable name is. Otherwise, the program will guess. The result may/may not be correct.
**kwargs- Handle deprecated arguments such as
PlateReconstruction_object,filename, andarray.
Expand source code
class Raster(object): """The Raster class handles raster data. `Raster`'s functionalities include sampling data at points using spline interpolation, resampling rasters with new X and Y-direction spacings and resizing rasters using new X and Y grid pixel resolutions. NaN-type data in rasters can be replaced with the values of their nearest valid neighbours. Parameters ---------- data : str or array-like The raster data, either as a filename (`str`) or array. plate_reconstruction : PlateReconstruction Allows for the accessibility of PlateReconstruction object attributes. Namely, PlateReconstruction object attributes rotation_model, topology_features and static_polygons can be used in the `Raster` object if called using “self.plate_reconstruction.X”, where X is the attribute. extent : str or 4-tuple, default: 'global' 4-tuple to specify (min_lon, max_lon, min_lat, max_lat) extents of the raster. If no extents are supplied, full global extent [-180,180,-90,90] is assumed (equivalent to `extent='global'`). For array data with an upper-left origin, make sure `min_lat` is greater than `max_lat`, or specify `origin` parameter. resample : 2-tuple, optional Optionally resample grid, pass spacing in X and Y direction as a 2-tuple e.g. resample=(spacingX, spacingY). time : float, default: 0.0 The time step represented by the raster data. Used for raster reconstruction. origin : {'lower', 'upper'}, optional When `data` is an array, use this parameter to specify the origin (upper left or lower left) of the data (overriding `extent`). **kwargs Handle deprecated arguments such as `PlateReconstruction_object`, `filename`, and `array`. Attributes ---------- data : ndarray, shape (ny, nx) Array containing the underlying raster data. This attribute can be modified after creation of the `Raster`. plate_reconstruction : PlateReconstruction An object of GPlately's `PlateReconstruction` class, like the `rotation_model`, a set of reconstructable `topology_features` and `static_polygons` that belong to a particular plate model. These attributes can be used in the `Raster` object if called using “self.plate_reconstruction.X”, where X is the attribute. This attribute can be modified after creation of the `Raster`. extent : tuple of floats Four-element array to specify [min lon, max lon, min lat, max lat] extents of any sampling points. If no extents are supplied, full global extent [-180,180,-90,90] is assumed. lons : ndarray, shape (nx,) The x-coordinates of the raster data. This attribute can be modified after creation of the `Raster`. lats : ndarray, shape (ny,) The y-coordinates of the raster data. This attribute can be modified after creation of the `Raster`. origin : {'lower', 'upper'} The origin (lower or upper left) or the data array. filename : str or None The filename used to create the `Raster` object. If the object was created directly from an array, this attribute is `None`. Methods ------- interpolate(lons, lats, method='linear', return_indices=False) Sample gridded data at a set of points using spline interpolation. resample(spacingX, spacingY, overwrite=False) Resamples the grid using X & Y-spaced lat-lon arrays, meshed with linear interpolation. resize(resX, resY, overwrite=False) Resizes the grid with a specific resolution and samples points using linear interpolation. fill_NaNs(overwrite=False) Searches for invalid 'data' cells containing NaN-type entries and replaces NaNs with the value of the nearest valid data cell. reconstruct(time, fill_value=None, partitioning_features=None, threads=1, anchor_plate_id=None, inplace=False) Reconstruct the raster from its initial time (`self.time`) to a new time. """ def __init__( self, data=None, plate_reconstruction=None, extent="global", realign=False, resample=None, resize=None, time=0.0, origin=None, x_dimension_name: str = "", y_dimension_name: str = "", data_variable_name: str = "", **kwargs, ): """Constructs all necessary attributes for the raster object. Note: either a str path to a netCDF file OR an ndarray representing a grid must be specified. Parameters ---------- data : str or array-like The raster data, either as a filename (`str`) or array. plate_reconstruction : PlateReconstruction Allows for the accessibility of PlateReconstruction object attributes. Namely, PlateReconstruction object attributes rotation_model, topology_featues and static_polygons can be used in the points object if called using “self.plate_reconstruction.X”, where X is the attribute. extent : str or 4-tuple, default: 'global' 4-tuple to specify (min_lon, max_lon, min_lat, max_lat) extents of the raster. If no extents are supplied, full global extent [-180,180,-90,90] is assumed (equivalent to `extent='global'`). For array data with an upper-left origin, make sure `min_lat` is greater than `max_lat`, or specify `origin` parameter. resample : 2-tuple, optional Optionally resample grid, pass spacing in X and Y direction as a 2-tuple e.g. resample=(spacingX, spacingY). resize : 2-tuple, optional Optionally resample grid to X-columns, Y-rows as a 2-tuple e.g. resample=(resX, resY). time : float, default: 0.0 The time step represented by the raster data. Used for raster reconstruction. origin : {'lower', 'upper'}, optional When `data` is an array, use this parameter to specify the origin (upper left or lower left) of the data (overriding `extent`). x_dimension_name : str, optional, default="" If the grid file uses comman names, such as "x", "lon", "lons" or "longitude", you need not set this parameter. Otherwise, you need to tell us what the x dimension name is. y_dimension_name : str, optional, default="" If the grid file uses comman names, such as "y", "lat", "lats" or "latitude", you need not set this parameter. Otherwise, you need to tell us what the y dimension name is. data_variable_name : str, optional, default="" The program will try its best to determine the data variable name. However, it would be better if you could tell us what the data variable name is. Otherwise, the program will guess. The result may/may not be correct. **kwargs Handle deprecated arguments such as `PlateReconstruction_object`, `filename`, and `array`. """ if isinstance(data, self.__class__): self._data = data._data.copy() self.plate_reconstruction = data.plate_reconstruction self._lons = data._lons self._lats = data._lats self._time = data._time return if "PlateReconstruction_object" in kwargs.keys(): warnings.warn( "`PlateReconstruction_object` keyword argument has been " + "deprecated, use `plate_reconstruction` instead", DeprecationWarning, ) if plate_reconstruction is None: plate_reconstruction = kwargs.pop("PlateReconstruction_object") if "filename" in kwargs.keys() and "array" in kwargs.keys(): raise TypeError( "Both `filename` and `array` were provided; use " + "one or the other, or use the `data` argument" ) if "filename" in kwargs.keys(): warnings.warn( "`filename` keyword argument has been deprecated, " + "use `data` instead", DeprecationWarning, ) if data is None: data = kwargs.pop("filename") if "array" in kwargs.keys(): warnings.warn( "`array` keyword argument has been deprecated, " + "use `data` instead", DeprecationWarning, ) if data is None: data = kwargs.pop("array") for key in kwargs.keys(): raise TypeError( "Raster.__init__() got an unexpected keyword argument " + "'{}'".format(key) ) self.plate_reconstruction = plate_reconstruction if time < 0.0: raise ValueError("Invalid time: {}".format(time)) time = float(time) self._time = time if data is None: raise TypeError("`data` argument (or `filename` or `array`) is required") if isinstance(data, str): # Filename self._filename = data self._data, lons, lats = read_netcdf_grid( data, return_grids=True, realign=realign, resample=resample, resize=resize, x_dimension_name=x_dimension_name, y_dimension_name=y_dimension_name, data_variable_name=data_variable_name, ) self._lons = lons self._lats = lats else: # numpy array self._filename = None extent = _parse_extent_origin(extent, origin) data = _check_grid(data) self._data = np.array(data) self._lons = np.linspace(extent[0], extent[1], self.data.shape[1]) self._lats = np.linspace(extent[2], extent[3], self.data.shape[0]) if realign: # realign to -180,180 and flip grid self._data, self._lons, self._lats = _realign_grid( self._data, self._lons, self._lats ) if (not isinstance(data, str)) and (resample is not None): self.resample(*resample, inplace=True) if (not isinstance(data, str)) and (resize is not None): self.resize(*resize, inplace=True) @property def time(self): """The time step represented by the raster data.""" return self._time @property def data(self): """The object's raster data. Can be modified. """ return self._data @data.setter def data(self, z): z = np.array(z) if z.shape != np.shape(self.data): raise ValueError( "Shape mismatch: old dimensions are {}, new are {}".format( np.shape(self.data), z.shape, ) ) self._data = z @property def lons(self): """The x-coordinates of the raster data. Can be modified. """ return self._lons @lons.setter def lons(self, x): x = np.array(x).ravel() if x.size != np.shape(self.data)[1]: raise ValueError( "Shape mismatch: data x-dimension is {}, new value is {}".format( np.shape(self.data)[1], x.size, ) ) self._lons = x @property def lats(self): """The y-coordinates of the raster data. Can be modified. """ return self._lats @lats.setter def lats(self, y): y = np.array(y).ravel() if y.size != np.shape(self.data)[0]: raise ValueError( "Shape mismatch: data y-dimension is {}, new value is {}".format( np.shape(self.data)[0], y.size, ) ) self._lats = y @property def extent(self): """The spatial extent (x0, x1, y0, y1) of the data. If y0 < y1, the origin is the lower-left corner; else the upper-left. """ return ( float(self.lons[0]), float(self.lons[-1]), float(self.lats[0]), float(self.lats[-1]), ) @property def origin(self): """The origin of the data array, used for e.g. plotting.""" if self.lats[0] < self.lats[-1]: return "lower" else: return "upper" @property def shape(self): """The shape of the data array.""" return np.shape(self.data) @property def size(self): """The size of the data array.""" return np.size(self.data) @property def dtype(self): """The data type of the array.""" return self.data.dtype @property def ndim(self): """The number of dimensions in the array.""" return np.ndim(self.data) @property def filename(self): """The filename of the raster file used to create the object. If a NumPy array was used instead, this attribute is `None`. """ return self._filename @property def plate_reconstruction(self): """The `PlateReconstruction` object to be used for raster reconstruction. """ return self._plate_reconstruction @plate_reconstruction.setter def plate_reconstruction(self, reconstruction): if reconstruction is None: # Remove `plate_reconstruction` attribute pass elif not isinstance(reconstruction, _PlateReconstruction): # Convert to a `PlateReconstruction` if possible try: reconstruction = _PlateReconstruction(*reconstruction) except Exception: reconstruction = _PlateReconstruction(reconstruction) self._plate_reconstruction = reconstruction def copy(self): """Returns a copy of the Raster Returns ------- Raster A copy of the current Raster object """ return Raster( self.data.copy(), self.plate_reconstruction, self.extent, self.time ) def interpolate( self, lons, lats, method="linear", return_indices=False, ): """Interpolate a set of point data onto the gridded data provided to the `Raster` object. Parameters ---------- lons, lats : array_like The longitudes and latitudes of the points to interpolate onto the gridded data. Must be broadcastable to a common shape. method : str or int; default: 'linear' The order of spline interpolation. Must be an integer in the range 0-5. 'nearest', 'linear', and 'cubic' are aliases for 0, 1, and 3, respectively. return_indices : bool, default=False Whether to return the row and column indices of the nearest grid points. Returns ------- numpy.ndarray The values interpolated at the input points. indices : 2-tuple of numpy.ndarray The i- and j-indices of the nearest grid points to the input points, only present if `return_indices=True`. Raises ------ ValueError If an invalid `method` is provided. RuntimeWarning If `lats` contains any invalid values outside of the interval [-90, 90]. Invalid values will be clipped to this interval. Notes ----- If `return_indices` is set to `True`, the nearest array indices are returned as a tuple of arrays, in (i, j) or (lat, lon) format. An example output: # The first array holds the rows of the raster where point data spatially falls near. # The second array holds the columns of the raster where point data spatially falls near. sampled_indices = (array([1019, 1019, 1019, ..., 1086, 1086, 1087]), array([2237, 2237, 2237, ..., 983, 983, 983])) """ return sample_grid( lon=lons, lat=lats, grid=self, method=method, return_indices=return_indices, ) def resample(self, spacingX, spacingY, method="linear", inplace=False): """Resample the `grid` passed to the `Raster` object with a new `spacingX` and `spacingY` using linear interpolation. Notes ----- Ultimately, `resample` changes the lat-lon resolution of the gridded data. The larger the x and y spacings given are, the larger the pixellation of raster data. `resample` creates new latitude and longitude arrays with specified spacings in the X and Y directions (`spacingX` and `spacingY`). These arrays are linearly interpolated into a new raster. If `inplace` is set to `True`, the respaced latitude array, longitude array and raster will inplace the ones currently attributed to the `Raster` object. Parameters ---------- spacingX, spacingY : ndarray Specify the spacing in the X and Y directions with which to resample. The larger `spacingX` and `spacingY` are, the larger the raster pixels become (less resolved). Note: to keep the size of the raster consistent, set `spacingX = spacingY`; otherwise, if for example `spacingX > spacingY`, the raster will appear stretched longitudinally. method : str or int; default: 'linear' The order of spline interpolation. Must be an integer in the range 0-5. 'nearest', 'linear', and 'cubic' are aliases for 0, 1, and 3, respectively. inplace : bool, default=False Choose to overwrite the data (the `self.data` attribute), latitude array (`self.lats`) and longitude array (`self.lons`) currently attributed to the `Raster` object. Returns ------- Raster The resampled grid. If `inplace` is set to `True`, this raster overwrites the one attributed to `data`. """ spacingX = np.abs(spacingX) spacingY = np.abs(spacingY) if self.origin == "upper": spacingY *= -1.0 lons = np.arange(self.extent[0], self.extent[1] + spacingX, spacingX) lats = np.arange(self.extent[2], self.extent[3] + spacingY, spacingY) lonq, latq = np.meshgrid(lons, lats) data = self.interpolate(lonq, latq, method=method) if inplace: self._data = data self._lons = lons self._lats = lats else: return Raster(data, self.plate_reconstruction, self.extent, self.time) def resize(self, resX, resY, inplace=False, method="linear", return_array=False): """Resize the grid passed to the `Raster` object with a new x and y resolution (`resX` and `resY`) using linear interpolation. Notes ----- Ultimately, `resize` "stretches" a raster in the x and y directions. The larger the resolutions in x and y, the more stretched the raster appears in x and y. It creates new latitude and longitude arrays with specific resolutions in the X and Y directions (`resX` and `resY`). These arrays are linearly interpolated into a new raster. If `inplace` is set to `True`, the resized latitude, longitude arrays and raster will inplace the ones currently attributed to the `Raster` object. Parameters ---------- resX, resY : ndarray Specify the resolutions with which to resize the raster. The larger `resX` is, the more longitudinally-stretched the raster becomes. The larger `resY` is, the more latitudinally-stretched the raster becomes. method : str or int; default: 'linear' The order of spline interpolation. Must be an integer in the range 0-5. 'nearest', 'linear', and 'cubic' are aliases for 0, 1, and 3, respectively. inplace : bool, default=False Choose to overwrite the data (the `self.data` attribute), latitude array (`self.lats`) and longitude array (`self.lons`) currently attributed to the `Raster` object. return_array : bool, default False Return a `numpy.ndarray`, rather than a `Raster`. Returns ------- Raster The resized grid. If `inplace` is set to `True`, this raster overwrites the one attributed to `data`. """ # construct grid lons = np.linspace(self.extent[0], self.extent[1], resX) lats = np.linspace(self.extent[2], self.extent[3], resY) lonq, latq = np.meshgrid(lons, lats) data = self.interpolate(lonq, latq, method=method) if inplace: self._data = data self._lons = lons self._lats = lats if return_array: return data else: return Raster(data, self.plate_reconstruction, self.extent, self.time) def fill_NaNs(self, inplace=False, return_array=False): """Search raster for invalid ‘data’ cells containing NaN-type entries replaces them with the value of their nearest valid data cells. Parameters --------- inplace : bool, default=False Choose whether to overwrite the grid currently held in the `data` attribute with the filled grid. return_array : bool, default False Return a `numpy.ndarray`, rather than a `Raster`. Returns -------- Raster The resized grid. If `inplace` is set to `True`, this raster overwrites the one attributed to `data`. """ data = fill_raster(self.data) if inplace: self._data = data if return_array: return data else: return Raster(data, self.plate_reconstruction, self.extent, self.time) def save_to_netcdf4(self, filename, significant_digits=None, fill_value=np.nan): """Saves the grid attributed to the `Raster` object to the given `filename` (including the ".nc" extension) in netCDF4 format.""" write_netcdf_grid( str(filename), self.data, self.extent, significant_digits, fill_value ) def reconstruct( self, time, fill_value=None, partitioning_features=None, threads=1, anchor_plate_id=None, inplace=False, return_array=False, ): """Reconstruct raster data to a given time. Parameters ---------- time : float Time to which the data will be reconstructed. fill_value : float, int, str, or tuple, optional The value to be used for regions outside of the static polygons at `time`. By default (`fill_value=None`), this value will be determined based on the input. partitioning_features : sequence of Feature or str, optional The features used to partition the raster grid and assign plate IDs. By default, `self.plate_reconstruction.static_polygons` will be used, but alternatively any valid argument to 'pygplates.FeaturesFunctionArgument' can be specified here. threads : int, default 1 Number of threads to use for certain computationally heavy routines. anchor_plate_id : int, optional ID of the anchored plate. By default, reconstructions are made with respect to the anchor plate ID specified in the `gplately.PlateReconstruction` object. inplace : bool, default False Perform the reconstruction in-place (replace the raster's data with the reconstructed data). return_array : bool, default False Return a `numpy.ndarray`, rather than a `Raster`. Returns ------- Raster or np.ndarray The reconstructed grid. Areas for which no plate ID could be determined will be filled with `fill_value`. Raises ------ TypeError If this `Raster` has no `plate_reconstruction` set. Notes ----- For two-dimensional grids, `fill_value` should be a single number. The default value will be `np.nan` for float or complex types, the minimum value for integer types, and the maximum value for unsigned types. For RGB image grids, `fill_value` should be a 3-tuple RGB colour code or a matplotlib colour string. The default value will be black (0.0, 0.0, 0.0) or (0, 0, 0). For RGBA image grids, `fill_value` should be a 4-tuple RGBA colour code or a matplotlib colour string. The default fill value will be transparent black (0.0, 0.0, 0.0, 0.0) or (0, 0, 0, 0). """ if time < 0.0: raise ValueError("Invalid time: {}".format(time)) time = float(time) if self.plate_reconstruction is None: raise TypeError( "Cannot perform reconstruction - " + "`plate_reconstruction` has not been set" ) if partitioning_features is None: partitioning_features = self.plate_reconstruction.static_polygons result = reconstruct_grid( grid=self.data, partitioning_features=partitioning_features, rotation_model=self.plate_reconstruction.rotation_model, from_time=self.time, to_time=time, extent=self.extent, origin=self.origin, fill_value=fill_value, threads=threads, anchor_plate_id=anchor_plate_id, ) if inplace: self.data = result self._time = time if return_array: return result return self if not return_array: result = type(self)( data=result, plate_reconstruction=self.plate_reconstruction, extent=self.extent, time=time, origin=self.origin, ) return result def imshow(self, ax=None, projection=None, **kwargs): """Display raster data. A pre-existing matplotlib `Axes` instance is used if available, else a new one is created. The `origin` and `extent` of the image are determined automatically and should not be specified. Parameters ---------- ax : matplotlib.axes.Axes, optional If specified, the image will be drawn within these axes. projection : cartopy.crs.Projection, optional The map projection to be used. If both `ax` and `projection` are specified, this will be checked against the `projection` attribute of `ax`, if it exists. **kwargs : dict, optional Any further keyword arguments are passed to `matplotlib.pyplot.imshow` or `matplotlib.axes.Axes.imshow`, where appropriate. Returns ------- matplotlib.image.AxesImage Raises ------ ValueError If `ax` and `projection` are both specified, but do not match (i.e. `ax.projection != projection`). """ for kw in ("origin", "extent"): if kw in kwargs.keys(): raise TypeError( "imshow got an unexpected keyword argument: {}".format(kw) ) if ax is None: existing_figure = len(plt.get_fignums()) > 0 current_axes = plt.gca() if projection is None: ax = current_axes elif ( isinstance(current_axes, _GeoAxes) and current_axes.projection == projection ): ax = current_axes else: if not existing_figure: current_axes.remove() ax = plt.axes(projection=projection) elif projection is not None: # projection and ax both specified if isinstance(ax, _GeoAxes) and ax.projection == projection: pass # projections match else: raise ValueError( "Both `projection` and `ax` were specified, but" + " `projection` does not match `ax.projection`" ) if isinstance(ax, _GeoAxes) and "transform" not in kwargs.keys(): kwargs["transform"] = _PlateCarree() extent = self.extent if self.origin == "upper": extent = ( extent[0], extent[1], extent[3], extent[2], ) im = ax.imshow(self.data, origin=self.origin, extent=extent, **kwargs) return im plot = imshow def rotate_reference_frames( self, grid_spacing_degrees, reconstruction_time, from_rotation_features_or_model=None, # filename(s), or pyGPlates feature(s)/collection(s) or a RotationModel to_rotation_features_or_model=None, # filename(s), or pyGPlates feature(s)/collection(s) or a RotationModel from_rotation_reference_plate=0, to_rotation_reference_plate=0, non_reference_plate=701, output_name=None, ): """Rotate a grid defined in one plate model reference frame within a gplately.Raster object to another plate reconstruction model reference frame. Parameters ---------- grid_spacing_degrees : float The spacing (in degrees) for the output rotated grid. reconstruction_time : float The time at which to rotate the input grid. from_rotation_features_or_model : str, list of str, or instance of pygplates.RotationModel A filename, or a list of filenames, or a pyGPlates RotationModel object that defines the rotation model that the input grid is currently associated with. to_rotation_features_or_model : str, list of str, or instance of pygplates.RotationModel A filename, or a list of filenames, or a pyGPlates RotationModel object that defines the rotation model that the input grid shall be rotated with. from_rotation_reference_plate : int, default = 0 The current reference plate for the plate model the grid is defined in. Defaults to the anchor plate 0. to_rotation_reference_plate : int, default = 0 The desired reference plate for the plate model the grid is being rotated to. Defaults to the anchor plate 0. non_reference_plate : int, default = 701 An arbitrary placeholder reference frame with which to define the "from" and "to" reference frames. output_name : str, default None If passed, the rotated grid is saved as a netCDF grid to this filename. Returns ------- gplately.Raster() An instance of the gplately.Raster object containing the rotated grid. """ if from_rotation_features_or_model is None: if self.plate_reconstruction is None: raise ValueError("Set a plate reconstruction model") from_rotation_features_or_model = self.plate_reconstruction.rotation_model if to_rotation_features_or_model is None: if self.plate_reconstruction is None: raise ValueError("Set a plate reconstruction model") to_rotation_features_or_model = self.plate_reconstruction.rotation_model input_positions = [] # Create the pygplates.FiniteRotation that rotates # between the two reference frames. from_rotation_model = pygplates.RotationModel(from_rotation_features_or_model) to_rotation_model = pygplates.RotationModel(to_rotation_features_or_model) from_rotation = from_rotation_model.get_rotation( reconstruction_time, non_reference_plate, anchor_plate_id=from_rotation_reference_plate, ) to_rotation = to_rotation_model.get_rotation( reconstruction_time, non_reference_plate, anchor_plate_id=to_rotation_reference_plate, ) reference_frame_conversion_rotation = to_rotation * from_rotation.get_inverse() # Resize the input grid to the specified output resolution before rotating resX = _deg2pixels(grid_spacing_degrees, self.extent[0], self.extent[1]) resY = _deg2pixels(grid_spacing_degrees, self.extent[2], self.extent[3]) resized_input_grid = self.resize(resX, resY, inplace=False) # Get the flattened lons, lats llons, llats = np.meshgrid(resized_input_grid.lons, resized_input_grid.lats) llons = llons.ravel() llats = llats.ravel() # Convert lon-lat points of Raster grid to pyGPlates points input_points = pygplates.MultiPointOnSphere( (lat, lon) for lon, lat in zip(llons, llats) ) # Get grid values of the resized Raster object values = np.array(resized_input_grid.data).ravel() # Rotate grid nodes to the other reference frame output_points = reference_frame_conversion_rotation * input_points # Assemble rotated points with grid values. out_lon = np.empty_like(llons) out_lat = np.empty_like(llats) zdata = np.empty_like(values) for i, point in enumerate(output_points): out_lat[i], out_lon[i] = point.to_lat_lon() zdata[i] = values[i] # Create a regular grid on which to interpolate lats, lons and zdata # Use the extent of the original Raster object extent_globe = self.extent resX = ( int(np.floor((extent_globe[1] - extent_globe[0]) / grid_spacing_degrees)) + 1 ) resY = ( int(np.floor((extent_globe[3] - extent_globe[2]) / grid_spacing_degrees)) + 1 ) grid_lon = np.linspace(extent_globe[0], extent_globe[1], resX) grid_lat = np.linspace(extent_globe[2], extent_globe[3], resY) X, Y = np.meshgrid(grid_lon, grid_lat) # Interpolate lons, lats and zvals over a regular grid using nearest # neighbour interpolation Z = griddata_sphere((out_lon, out_lat), zdata, (X, Y), method="nearest") # Write output grid to netCDF if requested. if output_name: write_netcdf_grid(output_name, Z, extent=extent_globe) return Raster(data=Z) def query(self, lons, lats, region_of_interest=None): """Given a set of location coordinates, return the grid values at these locations Parameters ---------- lons: list a list of longitudes of the location coordinates lats: list a list of latitude of the location coordinates region_of_interest: float the radius of the region of interest in km this is the arch length. we need to calculate the straight distance between the two points in 3D space from this arch length. Returns ------- list a list of grid values for the given locations. """ if not hasattr(self, "spatial_cKDTree"): # build the spatial tree if the tree has not been built yet x0 = self.extent[0] x1 = self.extent[1] y0 = self.extent[2] y1 = self.extent[3] yn = self.data.shape[0] xn = self.data.shape[1] # we assume the grid is Grid-line Registration, not Pixel Registration # http://www.soest.hawaii.edu/pwessel/courses/gg710-01/GMT_grid.pdf # TODO: support both Grid-line and Pixel Registration grid_x, grid_y = np.meshgrid( np.linspace(x0, x1, xn), np.linspace(y0, y1, yn) ) # in degrees self.grid_cell_radius = ( math.sqrt(math.pow(((y0 - y1) / yn), 2) + math.pow(((x0 - x1) / xn), 2)) / 2 ) self.data_mask = ~np.isnan(self.data) grid_points = [ pygplates.PointOnSphere((float(p[1]), float(p[0]))).to_xyz() for p in np.dstack((grid_x, grid_y))[self.data_mask] ] logger.debug("building the spatial tree...") self.spatial_cKDTree = _cKDTree(grid_points) query_points = [ pygplates.PointOnSphere((float(p[1]), float(p[0]))).to_xyz() for p in zip(lons, lats) ] if region_of_interest is None: # convert the arch length(in degrees) to direct length in 3D space roi = 2 * math.sin(math.radians(self.grid_cell_radius / 2.0)) else: roi = 2 * math.sin( region_of_interest / pygplates.Earth.mean_radius_in_kms / 2.0 ) dists, indices = self.spatial_cKDTree.query( query_points, k=1, distance_upper_bound=roi ) # print(dists, indices) return np.concatenate((self.data[self.data_mask], [math.nan]))[indices] def clip_by_extent(self, extent): """clip the raster according to a given extent [x_min, x_max, y_min, y_max] the extent of the returned raster may be slightly bigger than the given extent. this happens when the border of the given extent fall between two gird lines. """ if ( extent[0] >= extent[1] or extent[2] >= extent[3] or extent[0] < -180 or extent[1] > 180 or extent[2] < -90 or extent[3] > 90 ): raise Exception(f"Invalid extent: {extent}") if ( extent[0] < self.extent[0] or extent[1] > self.extent[1] or extent[2] < self.extent[2] or extent[3] > self.extent[3] ): raise Exception( f"The given extent is out of scope. {extent} -- {self.extent}" ) y_len, x_len = self.data.shape logger.debug(f"the shape of raster data x:{x_len} y:{y_len}") x0 = math.floor( (extent[0] - self.extent[0]) / (self.extent[1] - self.extent[0]) * (x_len - 1) ) x1 = math.ceil( (extent[1] - self.extent[0]) / (self.extent[1] - self.extent[0]) * (x_len - 1) ) # print(x0, x1) y0 = math.floor( (extent[2] - self.extent[2]) / (self.extent[3] - self.extent[2]) * (y_len - 1) ) y1 = math.ceil( (extent[3] - self.extent[2]) / (self.extent[3] - self.extent[2]) * (y_len - 1) ) # print(y0, y1) new_extent = [ x0 / (x_len - 1) * (self.extent[1] - self.extent[0]) - 180, x1 / (x_len - 1) * (self.extent[1] - self.extent[0]) - 180, y0 / (y_len - 1) * (self.extent[3] - self.extent[2]) - 90, y1 / (y_len - 1) * (self.extent[3] - self.extent[2]) - 90, ] # print(new_extent) # print(self.data[y0 : y1 + 1, x0 : x1 + 1].shape) return Raster( data=self.data[y0 : y1 + 1, x0 : x1 + 1], extent=new_extent, ) def clip_by_polygon(self, polygon): """TODO:""" pass def __array__(self): return np.array(self.data) def __add__(self, other): if isinstance(other, Raster): # Return array, since we don't know which Raster # to take properties from return self.data + other.data # Return Raster with new data new_raster = self.copy() new_data = self.data + other new_raster.data = new_data return new_raster def __radd__(self, other): return self + other def __sub__(self, other): if isinstance(other, Raster): # Return array, since we don't know which Raster # to take properties from return self.data - other.data # Return Raster with new data new_raster = self.copy() new_data = self.data - other new_raster.data = new_data return new_raster def __rsub__(self, other): if isinstance(other, Raster): # Return array, since we don't know which Raster # to take properties from return other.data - self.data # Return Raster with new data new_raster = self.copy() new_data = other - self.data new_raster.data = new_data return new_raster def __mul__(self, other): if isinstance(other, Raster): # Return array, since we don't know which Raster # to take properties from return self.data * other.data # Return Raster with new data new_raster = self.copy() new_data = self.data * other new_raster.data = new_data return new_raster def __rmul__(self, other): return self * other def __truediv__(self, other): if isinstance(other, Raster): # Return array, since we don't know which Raster # to take properties from return self.data / other.data # Return Raster with new data new_raster = self.copy() new_data = self.data / other new_raster.data = new_data return new_raster def __rtruediv__(self, other): if isinstance(other, Raster): # Return array, since we don't know which Raster # to take properties from return other.data / self.data # Return Raster with new data new_raster = self.copy() new_data = other / self.data new_raster.data = new_data return new_raster def __floordiv__(self, other): if isinstance(other, Raster): # Return array, since we don't know which Raster # to take properties from return self.data // other.data # Return Raster with new data new_raster = self.copy() new_data = self.data // other new_raster.data = new_data return new_raster def __rfloordiv__(self, other): if isinstance(other, Raster): # Return array, since we don't know which Raster # to take properties from return other.data // self.data # Return Raster with new data new_raster = self.copy() new_data = other // self.data new_raster.data = new_data return new_raster def __mod__(self, other): if isinstance(other, Raster): # Return array, since we don't know which Raster # to take properties from return self.data % other.data # Return Raster with new data new_raster = self.copy() new_data = self.data % other new_raster.data = new_data return new_raster def __rmod__(self, other): if isinstance(other, Raster): # Return array, since we don't know which Raster # to take properties from return other.data % self.data # Return Raster with new data new_raster = self.copy() new_data = other % self.data new_raster.data = new_data return new_raster def __pow__(self, other): if isinstance(other, Raster): # Return array, since we don't know which Raster # to take properties from return self.data**other.data # Return Raster with new data new_raster = self.copy() new_data = self.data**other new_raster.data = new_data return new_raster def __rpow__(self, other): if isinstance(other, Raster): # Return array, since we don't know which Raster # to take properties from return other.data**self.data # Return Raster with new data new_raster = self.copy() new_data = other**self.data new_raster.data = new_data return new_rasterInstance variables
prop data-
The object's raster data.
Can be modified.
Expand source code
@property
def data(self):
    """The object's raster data.

    Can be modified.
    """
    return self._data
prop dtype-
The data type of the array.
Expand source code
@property
def dtype(self):
    """The data type of the array."""
    return self.data.dtype
prop extent-
The spatial extent (x0, x1, y0, y1) of the data.
If y0 < y1, the origin is the lower-left corner; else the upper-left.
Expand source code
@property
def extent(self):
    """The spatial extent (x0, x1, y0, y1) of the data.

    If y0 < y1, the origin is the lower-left corner; else the upper-left.
    """
    return (
        float(self.lons[0]),
        float(self.lons[-1]),
        float(self.lats[0]),
        float(self.lats[-1]),
    )
prop filename-
The filename of the raster file used to create the object.
If a NumPy array was used instead, this attribute is
None.Expand source code
@property
def filename(self):
    """The filename of the raster file used to create the object.

    If a NumPy array was used instead, this attribute is `None`.
    """
    return self._filename
prop lats-
The y-coordinates of the raster data.
Can be modified.
Expand source code
@property
def lats(self):
    """The y-coordinates of the raster data.

    Can be modified.
    """
    return self._lats
prop lons-
The x-coordinates of the raster data.
Can be modified.
Expand source code
@property
def lons(self):
    """The x-coordinates of the raster data.

    Can be modified.
    """
    return self._lons
prop ndim-
The number of dimensions in the array.
Expand source code
@property
def ndim(self):
    """The number of dimensions in the array."""
    return np.ndim(self.data)
prop origin-
The origin of the data array, used for e.g. plotting.
Expand source code
@property
def origin(self):
    """The origin of the data array, used for e.g. plotting."""
    if self.lats[0] < self.lats[-1]:
        return "lower"
    else:
        return "upper"
prop plate_reconstruction-
The
PlateReconstructionobject to be used for raster reconstruction.Expand source code
@property
def plate_reconstruction(self):
    """The `PlateReconstruction` object to be used for raster
    reconstruction.
    """
    return self._plate_reconstruction
prop shape-
The shape of the data array.
Expand source code
@property
def shape(self):
    """The shape of the data array."""
    return np.shape(self.data)
prop size-
The size of the data array.
Expand source code
@property
def size(self):
    """The size of the data array."""
    return np.size(self.data)
prop time-
The time step represented by the raster data.
Expand source code
@property
def time(self):
    """The time step represented by the raster data."""
    return self._time
Methods
def clip_by_extent(self, extent)-
clip the raster according to a given extent [x_min, x_max, y_min, y_max] the extent of the returned raster may be slightly bigger than the given extent. this happens when the border of the given extent fall between two gird lines.
def clip_by_polygon(self, polygon)-
TODO:
def copy(self)def fill_NaNs(self, inplace=False, return_array=False)-
Search raster for invalid ‘data’ cells containing NaN-type entries replaces them with the value of their nearest valid data cells.
Parameters
inplace:bool, default=False- Choose whether to overwrite the grid currently held in the
dataattribute with the filled grid. return_array:bool, defaultFalse- Return a
numpy.ndarray, rather than aRaster.
Returns
Raster- The resized grid. If
inplaceis set toTrue, this raster overwrites the one attributed todata.
def imshow(self, ax=None, projection=None, **kwargs)-
Display raster data.
A pre-existing matplotlib
Axesinstance is used if available, else a new one is created. Theoriginandextentof the image are determined automatically and should not be specified.Parameters
ax:matplotlib.axes.Axes, optional- If specified, the image will be drawn within these axes.
projection:cartopy.crs.Projection, optional- The map projection to be used. If both
axandprojectionare specified, this will be checked against theprojectionattribute ofax, if it exists. **kwargs:dict, optional- Any further keyword arguments are passed to
matplotlib.pyplot.imshowormatplotlib.axes.Axes.imshow, where appropriate.
Returns
matplotlib.image.AxesImage
Raises
ValueError- If
axandprojectionare both specified, but do not match (i.e.ax.projection != projection).
def interpolate(self, lons, lats, method='linear', return_indices=False)-
Interpolate a set of point data onto the gridded data provided to the
Rasterobject.Parameters
lons,lats:array_like- The longitudes and latitudes of the points to interpolate onto the gridded data. Must be broadcastable to a common shape.
method:strorint; default: 'linear'- The order of spline interpolation. Must be an integer in the range 0-5. 'nearest', 'linear', and 'cubic' are aliases for 0, 1, and 3, respectively.
return_indices:bool, default=False- Whether to return the row and column indices of the nearest grid points.
Returns
numpy.ndarray- The values interpolated at the input points.
indices:2-tupleofnumpy.ndarray- The i- and j-indices of the nearest grid points to the input
points, only present if
return_indices=True.
Raises
ValueError- If an invalid
methodis provided. RuntimeWarning- If
latscontains any invalid values outside of the interval [-90, 90]. Invalid values will be clipped to this interval.
Notes
If
return_indicesis set toTrue, the nearest array indices are returned as a tuple of arrays, in (i, j) or (lat, lon) format.An example output:
# The first array holds the rows of the raster where point data spatially falls near.
# The second array holds the columns of the raster where point data spatially falls near.
sampled_indices = (array([1019, 1019, 1019, ..., 1086, 1086, 1087]), array([2237, 2237, 2237, ...,  983,  983,  983]))
def plot(self, ax=None, projection=None, **kwargs)-
Display raster data.
A pre-existing matplotlib
Axesinstance is used if available, else a new one is created. Theoriginandextentof the image are determined automatically and should not be specified.Parameters
ax:matplotlib.axes.Axes, optional- If specified, the image will be drawn within these axes.
projection:cartopy.crs.Projection, optional- The map projection to be used. If both
axandprojectionare specified, this will be checked against theprojectionattribute ofax, if it exists. **kwargs:dict, optional- Any further keyword arguments are passed to
matplotlib.pyplot.imshowormatplotlib.axes.Axes.imshow, where appropriate.
Returns
matplotlib.image.AxesImage
Raises
ValueError- If
axandprojectionare both specified, but do not match (i.e.ax.projection != projection).
def query(self, lons, lats, region_of_interest=None)-
Given a set of location coordinates, return the grid values at these locations
Parameters
lons:list- a list of longitudes of the location coordinates
lats:list- a list of latitude of the location coordinates
region_of_interest:float- the radius of the region of interest in km this is the arch length. we need to calculate the straight distance between the two points in 3D space from this arch length.
Returns
list- a list of grid values for the given locations.
def reconstruct(self, time, fill_value=None, partitioning_features=None, threads=1, anchor_plate_id=None, inplace=False, return_array=False)-
Reconstruct raster data to a given time.
Parameters
time:float- Time to which the data will be reconstructed.
fill_value:float, int, str,ortuple, optional- The value to be used for regions outside of the static polygons
at
time. By default (fill_value=None), this value will be determined based on the input. partitioning_features:sequenceofFeatureorstr, optional- The features used to partition the raster grid and assign plate
IDs. By default,
self.plate_reconstruction.static_polygonswill be used, but alternatively any valid argument to 'pygplates.FeaturesFunctionArgument' can be specified here. threads:int, default1- Number of threads to use for certain computationally heavy routines.
anchor_plate_id:int, optional- ID of the anchored plate. By default, reconstructions are made with respect to
the anchor plate ID specified in the
PlateReconstructionobject. inplace:bool, defaultFalse- Perform the reconstruction in-place (replace the raster's data with the reconstructed data).
return_array:bool, defaultFalse- Return a
numpy.ndarray, rather than aRaster.
Returns
Rasterornp.ndarray- The reconstructed grid. Areas for which no plate ID could be
determined will be filled with
fill_value.
Raises
TypeError- If this
Rasterhas noplate_reconstructionset.
Notes
For two-dimensional grids,
fill_valueshould be a single number. The default value will benp.nanfor float or complex types, the minimum value for integer types, and the maximum value for unsigned types. For RGB image grids,fill_valueshould be a 3-tuple RGB colour code or a matplotlib colour string. The default value will be black (0.0, 0.0, 0.0) or (0, 0, 0). For RGBA image grids,fill_valueshould be a 4-tuple RGBA colour code or a matplotlib colour string. The default fill value will be transparent black (0.0, 0.0, 0.0, 0.0) or (0, 0, 0, 0). def resample(self, spacingX, spacingY, method='linear', inplace=False)-
Resample the
gridpassed to theRasterobject with a newspacingXandspacingYusing linear interpolation.Notes
Ultimately,
resamplechanges the lat-lon resolution of the gridded data. The larger the x and y spacings given are, the larger the pixellation of raster data.resamplecreates new latitude and longitude arrays with specified spacings in the X and Y directions (spacingXandspacingY). These arrays are linearly interpolated into a new raster. Ifinplaceis set toTrue, the respaced latitude array, longitude array and raster will inplace the ones currently attributed to theRasterobject.Parameters
spacingX,spacingY:ndarray- Specify the spacing in the X and Y directions with which to resample. The larger
spacingXandspacingYare, the larger the raster pixels become (less resolved). Note: to keep the size of the raster consistent, setspacingX = spacingY; otherwise, if for examplespacingX > spacingY, the raster will appear stretched longitudinally. method:strorint; default: 'linear'- The order of spline interpolation. Must be an integer in the range 0-5. 'nearest', 'linear', and 'cubic' are aliases for 0, 1, and 3, respectively.
inplace:bool, default=False- Choose to overwrite the data (the
self.dataattribute), latitude array (self.lats) and longitude array (self.lons) currently attributed to theRasterobject.
Returns
Raster- The resampled grid. If
inplaceis set toTrue, this raster overwrites the one attributed todata.
def resize(self, resX, resY, inplace=False, method='linear', return_array=False)-
Resize the grid passed to the
Rasterobject with a new x and y resolution (resXandresY) using linear interpolation.Notes
Ultimately,
resize"stretches" a raster in the x and y directions. The larger the resolutions in x and y, the more stretched the raster appears in x and y.It creates new latitude and longitude arrays with specific resolutions in the X and Y directions (
resXandresY). These arrays are linearly interpolated into a new raster. Ifinplaceis set toTrue, the resized latitude, longitude arrays and raster will inplace the ones currently attributed to theRasterobject.Parameters
resX,resY:ndarray- Specify the resolutions with which to resize the raster. The larger
resXis, the more longitudinally-stretched the raster becomes. The largerresYis, the more latitudinally-stretched the raster becomes. method:strorint; default: 'linear'- The order of spline interpolation. Must be an integer in the range 0-5. 'nearest', 'linear', and 'cubic' are aliases for 0, 1, and 3, respectively.
inplace:bool, default=False- Choose to overwrite the data (the
self.dataattribute), latitude array (self.lats) and longitude array (self.lons) currently attributed to theRasterobject. return_array:bool, defaultFalse- Return a
numpy.ndarray, rather than aRaster.
Returns
Raster- The resized grid. If
inplaceis set toTrue, this raster overwrites the one attributed todata.
def rotate_reference_frames(self, grid_spacing_degrees, reconstruction_time, from_rotation_features_or_model=None, to_rotation_features_or_model=None, from_rotation_reference_plate=0, to_rotation_reference_plate=0, non_reference_plate=701, output_name=None)-
Rotate a grid defined in one plate model reference frame within a gplately.Raster object to another plate reconstruction model reference frame.
Parameters
grid_spacing_degrees:float- The spacing (in degrees) for the output rotated grid.
reconstruction_time:float- The time at which to rotate the input grid.
from_rotation_features_or_model:str, listofstr,orinstanceofpygplates.RotationModel- A filename, or a list of filenames, or a pyGPlates RotationModel object that defines the rotation model that the input grid is currently associated with.
to_rotation_features_or_model:str, listofstr,orinstanceofpygplates.RotationModel- A filename, or a list of filenames, or a pyGPlates RotationModel object that defines the rotation model that the input grid shall be rotated with.
from_rotation_reference_plate:int, default= 0- The current reference plate for the plate model the grid is defined in. Defaults to the anchor plate 0.
to_rotation_reference_plate:int, default= 0- The desired reference plate for the plate model the grid is being rotated to. Defaults to the anchor plate 0.
non_reference_plate:int, default= 701- An arbitrary placeholder reference frame with which to define the "from" and "to" reference frames.
output_name:str, defaultNone- If passed, the rotated grid is saved as a netCDF grid to this filename.
Returns
Raster- An instance of the gplately.Raster object containing the rotated grid.
def save_to_netcdf4(self, filename, significant_digits=None, fill_value=nan)-
Saves the grid attributed to the
Rasterobject to the givenfilename(including the ".nc" extension) in netCDF4 format.
class SeafloorGrid (PlateReconstruction_object, PlotTopologies_object, max_time: Union[float, int], min_time: Union[float, int], ridge_time_step: Union[float, int], save_directory: Union[str, pathlib._local.Path] = 'seafloor-grid-output', file_collection: str = '', refinement_levels: int = 5, ridge_sampling: float = 0.5, extent: Tuple[float] = (-180, 180, -90, 90), grid_spacing: float = 0.1, subduction_collision_parameters=(5.0, 10.0), initial_ocean_mean_spreading_rate: float = 75.0, resume_from_checkpoints=False, zval_names: List[str] = ['SPREADING_RATE'], continent_mask_filename=None, use_continent_contouring=False)-
A class to generate grids that track data atop global ocean basin points (which emerge from mid ocean ridges) through geological time.
Parameters
PlateReconstruction_object:instanceof<gplately.PlateReconstruction>- A GPlately PlateReconstruction object with a
and a containing topology features. PlotTopologies_object:instanceof<gplately.PlotTopologies>- A GPlately PlotTopologies object with a continental polygon or COB terrane polygon file to mask grids with.
max_time:float- The maximum time for age gridding.
min_time:float- The minimum time for age gridding.
ridge_time_step:float- The delta time for resolving ridges (and thus age gridding).
save_directory:str, defaultNone'- The top-level directory to save all outputs to.
file_collection:str, default""- A string to identify the plate model used (will be automated later).
refinement_levels:int, default5- Control the number of points in the icosahedral mesh (higher integer means higher resolution of continent masks).
ridge_sampling:float, default0.5- Spatial resolution (in degrees) at which points that emerge from ridges are tessellated.
extent:tupleoffloat, default(-180.,180.,-90.,90.)- A tuple containing the mininum longitude, maximum longitude, minimum latitude and maximum latitude extents for all masking and final grids.
grid_spacing:float, default0.1- The degree spacing/interval with which to space grid points across all masking and
final grids. If
grid_spacingis provided, all grids will use it. If not,grid_spacingdefaults to 0.1. subduction_collision_parameters:len-2 tupleoffloat, default(5.0, 10.0)- A 2-tuple of (threshold velocity delta in kms/my, threshold distance to boundary per My in kms/my)
- initial_ocean_mean_spreading_rate : float, default 75.
- A spreading rate to uniformly allocate to points that define the initial ocean
- basin. These points will have inaccurate ages, but most of them will be phased
- out after points with plate-model prescribed ages emerge from ridges and spread
- to push them towards collision boundaries (where they are deleted).
resume_from_checkpoints:bool, defaultFalse- If set to
True, and the gridding preparation stage (continental masking and/or ridge seed building) is interrupted, SeafloorGrids will resume gridding preparation from the last successful preparation time. If set toFalse, SeafloorGrids will automatically overwrite all files insave_directoryif re-run after interruption, or normally re-run, thus beginning gridding preparation from scratch.Falsewill be useful if data allocated to the MOR seed points need to be augmented. zval_names:listofstr- A list containing string labels for the z values to attribute to points. Will be used as column headers for z value point dataframes.
continent_mask_filename:str- An optional parameter pointing to the full path to a continental mask for each timestep. Assuming the time is in the filename, i.e. "/path/to/continent_mask_0Ma.nc", it should be passed as "/path/to/continent_mask_{}Ma.nc" with curly brackets. Include decimal formatting if needed.
Expand source code
class SeafloorGrid(object): """A class to generate grids that track data atop global ocean basin points (which emerge from mid ocean ridges) through geological time. Parameters ---------- PlateReconstruction_object : instance of <gplately.PlateReconstruction> A GPlately PlateReconstruction object with a <pygplates.RotationModel> and a <pygplates.FeatureCollection> containing topology features. PlotTopologies_object : instance of <gplately.PlotTopologies> A GPlately PlotTopologies object with a continental polygon or COB terrane polygon file to mask grids with. max_time : float The maximum time for age gridding. min_time : float The minimum time for age gridding. ridge_time_step : float The delta time for resolving ridges (and thus age gridding). save_directory : str, default None' The top-level directory to save all outputs to. file_collection : str, default "" A string to identify the plate model used (will be automated later). refinement_levels : int, default 5 Control the number of points in the icosahedral mesh (higher integer means higher resolution of continent masks). ridge_sampling : float, default 0.5 Spatial resolution (in degrees) at which points that emerge from ridges are tessellated. extent : tuple of float, default (-180.,180.,-90.,90.) A tuple containing the mininum longitude, maximum longitude, minimum latitude and maximum latitude extents for all masking and final grids. grid_spacing : float, default 0.1 The degree spacing/interval with which to space grid points across all masking and final grids. If `grid_spacing` is provided, all grids will use it. If not, `grid_spacing` defaults to 0.1. subduction_collision_parameters : len-2 tuple of float, default (5.0, 10.0) A 2-tuple of (threshold velocity delta in kms/my, threshold distance to boundary per My in kms/my) initial_ocean_mean_spreading_rate : float, default 75. A spreading rate to uniformly allocate to points that define the initial ocean basin. These points will have inaccurate ages, but most of them will be phased out after points with plate-model prescribed ages emerge from ridges and spread to push them towards collision boundaries (where they are deleted). resume_from_checkpoints : bool, default False If set to `True`, and the gridding preparation stage (continental masking and/or ridge seed building) is interrupted, SeafloorGrids will resume gridding preparation from the last successful preparation time. If set to `False`, SeafloorGrids will automatically overwrite all files in `save_directory` if re-run after interruption, or normally re-run, thus beginning gridding preparation from scratch. `False` will be useful if data allocated to the MOR seed points need to be augmented. zval_names : list of str A list containing string labels for the z values to attribute to points. Will be used as column headers for z value point dataframes. continent_mask_filename : str An optional parameter pointing to the full path to a continental mask for each timestep. Assuming the time is in the filename, i.e. "/path/to/continent_mask_0Ma.nc", it should be passed as "/path/to/continent_mask_{}Ma.nc" with curly brackets. Include decimal formatting if needed. """ def __init__( self, PlateReconstruction_object, PlotTopologies_object, max_time: Union[float, int], min_time: Union[float, int], ridge_time_step: Union[float, int], save_directory: Union[str, Path] = "seafloor-grid-output", file_collection: str = "", refinement_levels: int = 5, ridge_sampling: float = 0.5, extent: Tuple[float] = (-180, 180, -90, 90), grid_spacing: float = 0.1, subduction_collision_parameters=(5.0, 10.0), initial_ocean_mean_spreading_rate: float = 75.0, resume_from_checkpoints=False, zval_names: List[str] = ["SPREADING_RATE"], continent_mask_filename=None, use_continent_contouring=False, ): # Provides a rotation model, topology features and reconstruction time for the SeafloorGrid self.PlateReconstruction_object = PlateReconstruction_object self.rotation_model = self.PlateReconstruction_object.rotation_model self.topology_features = self.PlateReconstruction_object.topology_features self._PlotTopologies_object = PlotTopologies_object self.topological_model = pygplates.TopologicalModel( self.topology_features, self.rotation_model ) self.file_collection = file_collection if continent_mask_filename: # Filename for continental masks that the user can provide instead of building it here self.continent_mask_filepath = continent_mask_filename self.continent_mask_is_provided = True else: self.continent_mask_is_provided = False self.use_continent_contouring = use_continent_contouring self._setup_output_paths(save_directory) # Topological parameters self.refinement_levels = refinement_levels self.ridge_sampling = ridge_sampling self.subduction_collision_parameters = subduction_collision_parameters self.initial_ocean_mean_spreading_rate = initial_ocean_mean_spreading_rate # Gridding parameters self.extent = extent self._set_grid_resolution(grid_spacing) self.resume_from_checkpoints = resume_from_checkpoints # Temporal parameters self._max_time = max_time self._min_time = min_time self._ridge_time_step = ridge_time_step self._times = np.arange( self._max_time, self._min_time - 0.1, -self._ridge_time_step ) # ensure the time for continental masking is consistent. self._PlotTopologies_object.time = self._max_time # Essential features and meshes for the SeafloorGrid self.continental_polygons = ensure_polygon_geometry( self._PlotTopologies_object.continents, self.rotation_model, self._max_time ) self._PlotTopologies_object.continents = PlotTopologies_object.continents ( self.icosahedral_multi_point, self.icosahedral_global_mesh, ) = create_icosahedral_mesh(self.refinement_levels) # Z value parameters self.zval_names = zval_names self.default_column_headers = [ "CURRENT_LONGITUDES", "CURRENT_LATITUDES", "SEAFLOOR_AGE", "BIRTH_LAT_SNAPSHOT", "POINT_ID_SNAPSHOT", ] self.total_column_headers = self.default_column_headers + self.zval_names def _map_res_to_node_percentage(self, continent_mask_filename): """Determine which percentage to use to scale the continent mask resolution at max time""" maskY, maskX = grids.read_netcdf_grid( continent_mask_filename.format(self._max_time) ).shape mask_deg = _pixels2deg(maskX, self.extent[0], self.extent[1]) if mask_deg <= 0.1: percentage = 0.1 elif mask_deg <= 0.25: percentage = 0.3 elif mask_deg <= 0.5: percentage = 0.5 elif mask_deg < 0.75: percentage = 0.6 elif mask_deg >= 1: percentage = 0.75 return mask_deg, percentage def _setup_output_paths(self, save_directory): """create various folders for output files""" self.save_directory = Path(save_directory) # zvalue files self.zvalues_directory = os.path.join(self.save_directory, "zvalues") Path(self.zvalues_directory).mkdir(parents=True, exist_ok=True) zvalues_file_basename = "point_data_dataframe_{:0.2f}Ma.npz" if self.file_collection: zvalues_file_basename = self.file_collection + "_" + zvalues_file_basename self.zvalues_file_basepath = os.path.join( self.zvalues_directory, zvalues_file_basename ) # middle ocean ridge files self.mid_ocean_ridges_dir = os.path.join( self.save_directory, "middle_ocean_ridges" ) Path(self.mid_ocean_ridges_dir).mkdir(parents=True, exist_ok=True) if self.file_collection: self.mid_ocean_ridges_file_path = os.path.join( self.mid_ocean_ridges_dir, self.file_collection + "_" + MOR_PKL_FILE_NAME, ) else: self.mid_ocean_ridges_file_path = os.path.join( self.mid_ocean_ridges_dir, MOR_PKL_FILE_NAME ) # continent mask files # only generate continent mask files if user does not provide them if not self.continent_mask_is_provided: self.continent_mask_directory = os.path.join( self.save_directory, "continent_mask" ) Path(self.continent_mask_directory).mkdir(parents=True, exist_ok=True) if self.use_continent_contouring: continent_mask_file_basename = ( "continent_mask_ptt_continent_contouring_{:0.2f}Ma.nc" ) else: continent_mask_file_basename = "continent_mask_{:0.2f}Ma.nc" if self.file_collection: continent_mask_file_basename = ( self.file_collection + "_" + continent_mask_file_basename ) self.continent_mask_filepath = os.path.join( self.continent_mask_directory, continent_mask_file_basename ) # sample points files self.sample_points_dir = os.path.join(self.save_directory, "sample_points") Path(self.sample_points_dir).mkdir(parents=True, exist_ok=True) if self.file_collection: self.sample_points_file_path = os.path.join( self.sample_points_dir, self.file_collection + "_" + SAMPLE_POINTS_PKL_FILE_NAME, ) else: self.sample_points_file_path = os.path.join( self.sample_points_dir, SAMPLE_POINTS_PKL_FILE_NAME ) # gridding input files self.gridding_input_directory = os.path.join( self.save_directory, "gridding_input" ) Path(self.gridding_input_directory).mkdir(parents=True, exist_ok=True) gridding_input_basename = "gridding_input_{:0.2f}Ma.npz" if self.file_collection: gridding_input_basename = ( self.file_collection + "_" + gridding_input_basename ) self.gridding_input_filepath = os.path.join( self.gridding_input_directory, gridding_input_basename ) def _set_grid_resolution(self, grid_spacing=0.1): """determine the output grid resolution""" if not grid_spacing: grid_spacing = 0.1 # A list of degree spacings that allow an even division of the global lat-lon extent. divisible_degree_spacings = [0.1, 0.25, 0.5, 0.75, 1.0] # If the provided degree spacing is in the list of permissible spacings, use it # and prepare the number of pixels in x and y (spacingX and spacingY) if grid_spacing in divisible_degree_spacings: self.grid_spacing = grid_spacing self.spacingX = _deg2pixels(grid_spacing, self.extent[0], self.extent[1]) self.spacingY = _deg2pixels(grid_spacing, self.extent[2], self.extent[3]) # If the provided spacing is >>1 degree, use 1 degree elif grid_spacing >= divisible_degree_spacings[-1]: self.grid_spacing = divisible_degree_spacings[-1] self.spacingX = _deg2pixels( divisible_degree_spacings[-1], self.extent[0], self.extent[1] ) self.spacingY = _deg2pixels( divisible_degree_spacings[-1], self.extent[2], self.extent[3] ) with warnings.catch_warnings(): warnings.simplefilter("always") warnings.warn( f"The provided grid_spacing of {grid_spacing} is quite large. To preserve the grid resolution, a {self.grid_spacing} degree spacing has been employed instead." ) # If the provided degree spacing is not in the list of permissible spacings, but below # a degree, find the closest permissible degree spacing. Use this and find # spacingX and spacingY. else: for divisible_degree_spacing in divisible_degree_spacings: # The tolerance is half the difference between consecutive divisible spacings. # Max is 1 degree for now - other integers work but may provide too little of a # grid resolution. if abs(grid_spacing - divisible_degree_spacing) <= 0.125: new_deg_res = divisible_degree_spacing self.grid_spacing = new_deg_res self.spacingX = _deg2pixels( new_deg_res, self.extent[0], self.extent[1] ) self.spacingY = _deg2pixels( new_deg_res, self.extent[2], self.extent[3] ) with warnings.catch_warnings(): warnings.simplefilter("always") warnings.warn( f"The provided grid_spacing of {grid_spacing} does not cleanly divide into the global extent. A degree spacing of {self.grid_spacing} has been employed instead." ) # Allow SeafloorGrid time to be updated, and to update the internally-used # PlotTopologies' time attribute too. If PlotTopologies is used outside the # object, its `time` attribute is not updated. @property def max_time(self): """The reconstruction time.""" return self._max_time @property def PlotTopologiesTime(self): return self._PlotTopologies_object.time @max_time.setter def max_time(self, var): if var >= 0: self.update_time(var) else: raise ValueError("Enter a valid time >= 0") def update_time(self, max_time): self._max_time = float(max_time) self._PlotTopologies_object.time = float(max_time) def _collect_point_data_in_dataframe(self, feature_collection, zval_ndarray, time): """At a given timestep, create a pandas dataframe holding all attributes of point features. Rather than store z values as shapefile attributes, store them in a dataframe indexed by feature ID. """ return _collect_point_data_in_dataframe( self.zvalues_file_basepath, feature_collection, self.zval_names, zval_ndarray, time, ) def _generate_ocean_points(self): """generate ocean points by using the icosahedral mesh""" # Ensure COB terranes at max time have reconstruction IDs and valid times COB_polygons = ensure_polygon_geometry( self._PlotTopologies_object.continents, self.rotation_model, self._max_time, ) # zval is a binary array encoding whether a point # coordinate is within a COB terrane polygon or not. # Use the icosahedral mesh MultiPointOnSphere attribute _, ocean_basin_point_mesh, zvals = point_in_polygon_routine( self.icosahedral_multi_point, COB_polygons ) # Plates to partition with plate_partitioner = pygplates.PlatePartitioner( COB_polygons, self.rotation_model, ) # Plate partition the ocean basin points meshnode_feature = pygplates.Feature( pygplates.FeatureType.create_from_qualified_string("gpml:MeshNode") ) meshnode_feature.set_geometry( ocean_basin_point_mesh # multi_point ) ocean_basin_meshnode = pygplates.FeatureCollection(meshnode_feature) paleogeography = plate_partitioner.partition_features( ocean_basin_meshnode, partition_return=pygplates.PartitionReturn.separate_partitioned_and_unpartitioned, properties_to_copy=[pygplates.PropertyName.gpml_shapefile_attributes], ) return paleogeography[1] # points in oceans def _get_ocean_points_from_continent_mask(self): """get the ocean points from continent mask grid""" max_time_cont_mask = grids.Raster( self.continent_mask_filepath.format(self._max_time) ) # If the user provides a continental mask filename, we need to downsize the mask # resolution for when we create the initial ocean mesh. The mesh does not need to be high-res. # If the input grid is at 0.5 degree uniform spacing, then the input # grid is 7x more populated than a 6-level stripy icosahedral mesh and # using this resolution for the initial ocean mesh will dramatically slow down reconstruction by topologies. # Scale down the resolution based on the input mask resolution _, percentage = self._map_res_to_node_percentage(self.continent_mask_filepath) max_time_cont_mask.resize( int(max_time_cont_mask.shape[0] * percentage), int(max_time_cont_mask.shape[1] * percentage), inplace=True, ) lat = np.linspace(-90, 90, max_time_cont_mask.shape[0]) lon = np.linspace(-180, 180, max_time_cont_mask.shape[1]) llon, llat = np.meshgrid(lon, lat) mask_inds = np.where(max_time_cont_mask.data.flatten() == 0) mask_vals = max_time_cont_mask.data.flatten() mask_lon = llon.flatten()[mask_inds] mask_lat = llat.flatten()[mask_inds] ocean_pt_feature = pygplates.Feature() ocean_pt_feature.set_geometry( pygplates.MultiPointOnSphere(zip(mask_lat, mask_lon)) ) return [ocean_pt_feature] def create_initial_ocean_seed_points(self): """Create the initial ocean basin seed point domain (at `max_time` only) using Stripy's icosahedral triangulation with the specified `self.refinement_levels`. The ocean mesh starts off as a global-spanning Stripy icosahedral mesh. `create_initial_ocean_seed_points` passes the automatically-resolved-to-current-time continental polygons from the `PlotTopologies_object`'s `continents` attribute (which can be from a COB terrane file or a continental polygon file) into Plate Tectonic Tools' point-in-polygon routine. It identifies ocean basin points that lie: * outside the polygons (for the ocean basin point domain) * inside the polygons (for the continental mask) Points from the mesh outside the continental polygons make up the ocean basin seed point mesh. The masked mesh is outputted as a compressed GPML (GPMLZ) file with the filename: "ocean_basin_seed_points_{}Ma.gpmlz" if a `save_directory` is passed. Otherwise, the mesh is returned as a pyGPlates FeatureCollection object. Notes ----- This point mesh represents ocean basin seafloor that was produced before `SeafloorGrid.max_time`, and thus has unknown properties like valid time and spreading rate. As time passes, the plate reconstruction model sees points emerging from MORs. These new points spread to occupy the ocean basins, moving the initial filler points closer to subduction zones and continental polygons with which they can collide. If a collision is detected by `PlateReconstruction`s `ReconstructByTopologies` object, these points are deleted. Ideally, if a reconstruction tree spans a large time range, **all** initial mesh points would collide with a continent or be subducted, leaving behind a mesh of well-defined MOR-emerged ocean basin points that data can be attributed to. However, some of these initial points situated close to contiental boundaries are retained through time - these form point artefacts with anomalously high ages. Even deep-time plate models (e.g. 1 Ga) will have these artefacts - removing them would require more detail to be added to the reconstruction model. Returns ------- ocean_basin_point_mesh : pygplates.FeatureCollection A feature collection of pygplates.PointOnSphere objects on the ocean basin. """ if ( os.path.isfile(self.continent_mask_filepath.format(self._max_time)) and self.continent_mask_is_provided ): # If a set of continent masks was passed, we can use max_time's continental # mask to build the initial profile of seafloor age. ocean_points = self._get_ocean_points_from_continent_mask() else: ocean_points = self._generate_ocean_points() # Now that we have ocean points... # Determine age of ocean basin points using their proximity to MOR features # and an assumed globally-uniform ocean basin mean spreading rate. # We need resolved topologies at the `max_time` to pass into the proximity function resolved_topologies = [] shared_boundary_sections = [] pygplates.resolve_topologies( self.topology_features, self.rotation_model, resolved_topologies, self._max_time, shared_boundary_sections, ) pX, pY, pZ = tools.find_distance_to_nearest_ridge( resolved_topologies, shared_boundary_sections, ocean_points, ) # Divide spreading rate by 2 to use half the mean spreading rate pAge = np.array(pZ) / (self.initial_ocean_mean_spreading_rate / 2.0) self._update_current_active_points( pX, pY, pAge + self._max_time, [0] * len(pX), [self.initial_ocean_mean_spreading_rate] * len(pX), ) self.initial_ocean_point_df = self.current_active_points_df # the code below is for debug purpose only if get_debug_level() > 100: initial_ocean_point_features = [] for point in zip(pX, pY, pAge): point_feature = pygplates.Feature() point_feature.set_geometry(pygplates.PointOnSphere(point[1], point[0])) # Add 'time' to the age at the time of computation, to get the valid time in Ma point_feature.set_valid_time(point[2] + self._max_time, -1) # For now: custom zvals are added as shapefile attributes - will attempt pandas data frames # point_feature = set_shapefile_attribute(point_feature, self.initial_ocean_mean_spreading_rate, "SPREADING_RATE") # Seems like static data initial_ocean_point_features.append(point_feature) basename = "ocean_basin_seed_points_{}_RLs_{}Ma.gpmlz".format( self.refinement_levels, self._max_time, ) if self.file_collection: basename = "{}_{}".format(self.file_collection, basename) initial_ocean_feature_collection = pygplates.FeatureCollection( initial_ocean_point_features ) initial_ocean_feature_collection.write( os.path.join(self.save_directory, basename) ) # save the zvalue(spreading rate) of the initial ocean points to file "point_data_dataframe_{max_time}Ma.npz" self._collect_point_data_in_dataframe( initial_ocean_feature_collection, np.array( [self.initial_ocean_mean_spreading_rate] * len(pX) ), # for now, spreading rate is one zvalue for initial ocean points. will other zvalues need to have a generalised workflow? self._max_time, ) def build_all_MOR_seedpoints(self): """Resolve mid-ocean ridges for all times between `min_time` and `max_time`, divide them into points that make up their shared sub-segments. Rotate these points to the left and right of the ridge using their stage rotation so that they spread from the ridge. Z-value allocation to each point is done here. In future, a function (like the spreading rate function) to calculate general z-data will be an input parameter. Notes ----- If MOR seed point building is interrupted, progress is safeguarded as long as `resume_from_checkpoints` is set to `True`. This assumes that points spread from ridges symmetrically, with the exception of large ridge jumps at successive timesteps. Therefore, z-values allocated to ridge-emerging points will appear symmetrical until changes in spreading ridge geometries create asymmetries. In future, this will have a checkpoint save feature so that execution (which occurs during preparation for ReconstructByTopologies and can take several hours) can be safeguarded against run interruptions. References ---------- get_mid_ocean_ridge_seedpoints() has been adapted from https://github.com/siwill22/agegrid-0.1/blob/master/automatic_age_grid_seeding.py#L117. """ overwrite = True if self.resume_from_checkpoints: overwrite = False try: num_cpus = multiprocessing.cpu_count() - 1 except NotImplementedError: num_cpus = 1 if num_cpus > 1: with multiprocessing.Pool(num_cpus) as pool: pool.map( partial( _generate_mid_ocean_ridge_points, delta_time=self._ridge_time_step, mid_ocean_ridges_file_path=self.mid_ocean_ridges_file_path, rotation_model=self.rotation_model, topology_features=self.topology_features, zvalues_file_basepath=self.zvalues_file_basepath, zval_names=self.zval_names, ridge_sampling=self.ridge_sampling, overwrite=overwrite, ), self._times[1:], ) else: for time in self._times[1:]: _generate_mid_ocean_ridge_points( time, delta_time=self._ridge_time_step, mid_ocean_ridges_file_path=self.mid_ocean_ridges_file_path, rotation_model=self.rotation_model, topology_features=self.topology_features, zvalues_file_basepath=self.zvalues_file_basepath, zval_names=self.zval_names, ridge_sampling=self.ridge_sampling, overwrite=overwrite, ) def _create_continental_mask(self, time_array): """Create a continental mask for each timestep.""" if time_array[0] != self._max_time: print( "Masking interrupted - resuming continental mask building at {} Ma!".format( time_array[0] ) ) for time in time_array: mask_fn = self.continent_mask_filepath.format(time) if os.path.isfile(mask_fn): logger.info( f"Continent mask file exists and will not create again -- {mask_fn}" ) continue self._PlotTopologies_object.time = time geoms = self._PlotTopologies_object.continents final_grid = grids.rasterise( geoms, key=1.0, shape=(self.spacingY, self.spacingX), extent=self.extent, origin="lower", ) final_grid[np.isnan(final_grid)] = 0.0 grids.write_netcdf_grid( self.continent_mask_filepath.format(time), final_grid.astype("i1"), extent=[-180, 180, -90, 90], fill_value=None, ) logger.info(f"Finished building a continental mask at {time} Ma!") return def _build_continental_mask(self, time: float, overwrite=False): """Create a continental mask for a given time.""" mask_fn = self.continent_mask_filepath.format(time) if os.path.isfile(mask_fn) and not overwrite: logger.info( f"Continent mask file exists and will not create again -- {mask_fn}" ) return self._PlotTopologies_object.time = time final_grid = grids.rasterise( self._PlotTopologies_object.continents, key=1.0, shape=(self.spacingY, self.spacingX), extent=self.extent, origin="lower", ) final_grid[np.isnan(final_grid)] = 0.0 grids.write_netcdf_grid( self.continent_mask_filepath.format(time), final_grid.astype("i1"), extent=[-180, 180, -90, 90], fill_value=None, ) logger.info(f"Finished building a continental mask at {time} Ma!") def build_all_continental_masks(self): """Create a continental mask to define the ocean basin for all times between `min_time` and `max_time`. Notes ----- Continental masking progress is safeguarded if ever masking is interrupted, provided that `resume_from_checkpoints` is set to `True`. The continental masks will be saved to f"continent_mask_{time}Ma.nc" as compressed netCDF4 files. """ if not self.continent_mask_is_provided: overwrite = True if self.resume_from_checkpoints: overwrite = False if self.use_continent_contouring: try: num_cpus = multiprocessing.cpu_count() - 1 except NotImplementedError: num_cpus = 1 if num_cpus > 1: with multiprocessing.Pool(num_cpus) as pool: pool.map( partial( _build_continental_mask_with_contouring, continent_mask_filepath=self.continent_mask_filepath, rotation_model=self.rotation_model, continent_features=self._PlotTopologies_object._continents, overwrite=overwrite, ), self._times, ) else: for time in self._times: _build_continental_mask_with_contouring( time, continent_mask_filepath=self.continent_mask_filepath, rotation_model=self.rotation_model, continent_features=self._PlotTopologies_object._continents, overwrite=overwrite, ) else: for time in self._times: self._build_continental_mask(time, overwrite) def _extract_zvalues_from_npz_to_ndarray(self, featurecollection, time): # NPZ file of seedpoint z values that emerged at this time loaded_npz = np.load(self.zvalues_file_basepath.format(time)) curr_zvalues = np.empty([len(featurecollection), len(self.zval_names)]) for i in range(len(self.zval_names)): # Account for the 0th index being for point feature IDs curr_zvalues[:, i] = np.array(loaded_npz["arr_{}".format(i)]) return curr_zvalues def prepare_for_reconstruction_by_topologies(self): """Prepare three main auxiliary files for seafloor data gridding: * Initial ocean seed points (at `max_time`) * Continental masks (from `max_time` to `min_time`) * MOR points (from `max_time` to `min_time`) Returns lists of all attributes for the initial ocean point mesh and all ridge points for all times in the reconstruction time array. """ # INITIAL OCEAN SEED POINT MESH ---------------------------------------------------- self.create_initial_ocean_seed_points() logger.info("Finished building initial_ocean_seed_points!") # MOR SEED POINTS AND CONTINENTAL MASKS -------------------------------------------- # The start time for seeding is controlled by whether the overwrite_existing_gridding_inputs # parameter is set to `True` (in which case the start time is `max_time`). If it is `False` # and; # - a run of seeding and continental masking was interrupted, and ridge points were # checkpointed at n Ma, seeding resumes at n-1 Ma until `min_time` or another interruption # occurs; # - seeding was completed but the subsequent gridding input creation was interrupted, # seeding is assumed completed and skipped. The workflow automatically proceeds to re-gridding. self.build_all_continental_masks() self.build_all_MOR_seedpoints() # load the initial ocean seed points lons = self.initial_ocean_point_df["lon"].tolist() lats = self.initial_ocean_point_df["lat"].tolist() active_points = [ pygplates.PointOnSphere(lat, lon) for lon, lat in zip(lons, lats) ] appearance_time = self.initial_ocean_point_df["begin_time"].tolist() birth_lat = lats prev_lat = lats prev_lon = lons zvalues = np.empty((0, len(self.zval_names))) zvalues = np.concatenate( ( zvalues, self.initial_ocean_point_df["SPREADING_RATE"].to_numpy()[..., None], ), axis=0, ) for time in self._times[1:]: # load MOR points for each time step df = pd.read_pickle(self.mid_ocean_ridges_file_path.format(time)) lons = df["lon"].tolist() lats = df["lat"].tolist() active_points += [ pygplates.PointOnSphere(lat, lon) for lon, lat in zip(lons, lats) ] appearance_time += [time] * len(lons) birth_lat += lats prev_lat += lats prev_lon += lons zvalues = np.concatenate( (zvalues, df[self.zval_names[0]].to_numpy()[..., None]), axis=0 ) return active_points, appearance_time, birth_lat, prev_lat, prev_lon, zvalues def _update_current_active_points( self, lons, lats, begin_times, end_times, spread_rates, replace=True ): """If the `replace` is true, use the new data to replace self.current_active_points_df. Otherwise, append the new data to the end of self.current_active_points_df""" data = { "lon": lons, "lat": lats, "begin_time": begin_times, "end_time": end_times, "SPREADING_RATE": spread_rates, } if replace: self.current_active_points_df = pd.DataFrame(data=data) else: self.current_active_points_df = pd.concat( [ self.current_active_points_df, pd.DataFrame(data=data), ], ignore_index=True, ) def _update_current_active_points_coordinates( self, reconstructed_points: List[pygplates.PointOnSphere] ): """Update the current active points with the reconstructed coordinates. The length of `reconstructed_points` must be the same with the length of self.current_active_points_df """ assert len(reconstructed_points) == len(self.current_active_points_df) lons = [] lats = [] begin_times = [] end_times = [] spread_rates = [] for i in range(len(reconstructed_points)): if reconstructed_points[i]: lat_lon = reconstructed_points[i].to_lat_lon() lons.append(lat_lon[1]) lats.append(lat_lon[0]) begin_times.append(self.current_active_points_df.loc[i, "begin_time"]) end_times.append(self.current_active_points_df.loc[i, "end_time"]) spread_rates.append( self.current_active_points_df.loc[i, "SPREADING_RATE"] ) self._update_current_active_points( lons, lats, begin_times, end_times, spread_rates ) def _remove_continental_points(self, time): """remove all the points which are inside continents at `time` from self.current_active_points_df""" gridZ, gridX, gridY = grids.read_netcdf_grid( self.continent_mask_filepath.format(time), return_grids=True ) ni, nj = gridZ.shape xmin = np.nanmin(gridX) xmax = np.nanmax(gridX) ymin = np.nanmin(gridY) ymax = np.nanmax(gridY) # TODO def remove_points_on_continents(row): i = int(round((ni - 1) * ((row.lat - ymin) / (ymax - ymin)))) j = int(round((nj - 1) * ((row.lon - xmin) / (xmax - xmin)))) i = 0 if i < 0 else i j = 0 if j < 0 else j i = ni - 1 if i > ni - 1 else i j = nj - 1 if j > nj - 1 else j if gridZ[i, j] > 0: return False else: return True m = self.current_active_points_df.apply(remove_points_on_continents, axis=1) self.current_active_points_df = self.current_active_points_df[m] def _load_middle_ocean_ridge_points(self, time): """add middle ocean ridge points at `time` to current_active_points_df""" df = pd.read_pickle(self.mid_ocean_ridges_file_path.format(time)) self._update_current_active_points( df["lon"], df["lat"], [time] * len(df), [0] * len(df), df["SPREADING_RATE"], replace=False, ) # obsolete code. keep here for a while. will delete later. -- 2024-05-30 if 0: fc = pygplates.FeatureCollection( self.mid_ocean_ridges_file_path.format(time) ) assert len(self.zval_names) > 0 lons = [] lats = [] begin_times = [] end_times = [] for feature in fc: lat_lon = feature.get_geometry().to_lat_lon() valid_time = feature.get_valid_time() lons.append(lat_lon[1]) lats.append(lat_lon[0]) begin_times.append(valid_time[0]) end_times.append(valid_time[1]) curr_zvalues = self._extract_zvalues_from_npz_to_ndarray(fc, time) self._update_current_active_points( lons, lats, begin_times, end_times, curr_zvalues[:, 0], replace=False ) def _save_gridding_input_data(self, time): """save the data into file for creating netcdf file later""" data_len = len(self.current_active_points_df["lon"]) np.savez_compressed( self.gridding_input_filepath.format(time), CURRENT_LONGITUDES=self.current_active_points_df["lon"], CURRENT_LATITUDES=self.current_active_points_df["lat"], SEAFLOOR_AGE=self.current_active_points_df["begin_time"] - time, BIRTH_LAT_SNAPSHOT=[0] * data_len, POINT_ID_SNAPSHOT=[0] * data_len, SPREADING_RATE=self.current_active_points_df["SPREADING_RATE"], ) def reconstruct_by_topological_model(self): """Use pygplates' TopologicalModel class to reconstruct seed points. This method is an alternative to reconstruct_by_topological() which uses Python code to do the reconstruction. """ self.create_initial_ocean_seed_points() logger.info("Finished building initial_ocean_seed_points!") self.build_all_continental_masks() self.build_all_MOR_seedpoints() # not necessary, but put here for readability purpose only self.current_active_points_df = self.initial_ocean_point_df time = int(self._max_time) while True: self.current_active_points_df.to_pickle( self.sample_points_file_path.format(time) ) self._save_gridding_input_data(time) # save debug file if get_debug_level() > 100: _save_seed_points_as_multipoint_coverage( self.current_active_points_df["lon"], self.current_active_points_df["lat"], self.current_active_points_df["begin_time"] - time, time, self.sample_points_dir, ) next_time = time - int(self._ridge_time_step) if next_time >= int(self._min_time): points = [ pygplates.PointOnSphere(row.lat, row.lon) for index, row in self.current_active_points_df.iterrows() ] # reconstruct_geometry() needs time to be integral value # https://www.gplates.org/docs/pygplates/generated/pygplates.topologicalmodel#pygplates.TopologicalModel.reconstruct_geometry reconstructed_time_span = self.topological_model.reconstruct_geometry( points, initial_time=time, youngest_time=next_time, time_increment=int(self._ridge_time_step), deactivate_points=pygplates.ReconstructedGeometryTimeSpan.DefaultDeactivatePoints( threshold_velocity_delta=self.subduction_collision_parameters[0] / 10, # cms/yr threshold_distance_to_boundary=self.subduction_collision_parameters[ 1 ], # kms/myr deactivate_points_that_fall_outside_a_network=True, ), ) reconstructed_points = reconstructed_time_span.get_geometry_points( next_time, return_inactive_points=True ) logger.info( f"Finished topological reconstruction of {len(self.current_active_points_df)} points from {time} to {next_time} Ma." ) # update the current activate points to prepare for the reconstruction to "next time" self._update_current_active_points_coordinates(reconstructed_points) self._remove_continental_points(next_time) self._load_middle_ocean_ridge_points(next_time) time = next_time else: break def reconstruct_by_topologies(self): """Obtain all active ocean seed points at `time` - these are points that have not been consumed at subduction zones or have not collided with continental polygons. All active points' latitudes, longitues, seafloor ages, spreading rates and all other general z-values are saved to a gridding input file (.npz). """ logger.info("Preparing all initial files...") # Obtain all info from the ocean seed points and all MOR points through time, store in # arrays ( active_points, appearance_time, birth_lat, prev_lat, prev_lon, zvalues, ) = self.prepare_for_reconstruction_by_topologies() #### Begin reconstruction by topology process: # Indices for all points (`active_points`) that have existed from `max_time` to `min_time`. point_id = range(len(active_points)) # Specify the default collision detection region as subduction zones default_collision = reconstruction._DefaultCollision( feature_specific_collision_parameters=[ ( pygplates.FeatureType.gpml_subduction_zone, self.subduction_collision_parameters, ) ] ) # In addition to the default subduction detection, also detect continental collisions collision_spec = reconstruction._ContinentCollision( # This filename string should not have a time formatted into it - this is # taken care of later. self.continent_mask_filepath, default_collision, verbose=False, ) # Call the reconstruct by topologies object topology_reconstruction = reconstruction._ReconstructByTopologies( self.rotation_model, self.topology_features, self._max_time, self._min_time, self._ridge_time_step, active_points, point_begin_times=appearance_time, detect_collisions=collision_spec, ) # Initialise the reconstruction. topology_reconstruction.begin_reconstruction() # Loop over the reconstruction times until the end of the reconstruction time span, or until # all points have entered their valid time range *and* either exited their time range or # have been deactivated (subducted forward in time or consumed by MOR backward in time). reconstruction_data = [] while True: logger.info( f"Reconstruct by topologies: working on time {topology_reconstruction.get_current_time():0.2f} Ma" ) # NOTE: # topology_reconstruction.get_active_current_points() and topology_reconstruction.get_all_current_points() # are different. The former is a subset of the latter, and it represents all points at the timestep that # have not collided with a continental or subduction boundary. The remainders in the latter are inactive # (NoneType) points, which represent the collided points. # We need to access active point data from topology_reconstruction.get_all_current_points() because it has # the same length as the list of all initial ocean points and MOR seed points that have ever emerged from # spreading ridge topologies through `max_time` to `min_time`. Therefore, it protects the time and space # order in which all MOR points through time were seeded by pyGPlates. At any given timestep, not all these # points will be active, but their indices are retained. Thus, z value allocation, point latitudes and # longitudes of active points will be correctly indexed if taking it from # topology_reconstruction.get_all_current_points(). curr_points = topology_reconstruction.get_active_current_points() curr_points_including_inactive = ( topology_reconstruction.get_all_current_points() ) logger.debug(f"the number of current active points is :{len(curr_points)}") logger.debug( f"the number of all current points is :{len(curr_points_including_inactive)}" ) # Collect latitudes and longitudes of currently ACTIVE points in the ocean basin curr_lat_lon_points = [point.to_lat_lon() for point in curr_points] if curr_lat_lon_points: # Get the number of active points at this timestep. num_current_points = len(curr_points) # ndarray to fill with active point lats, lons and zvalues # FOR NOW, the number of gridding input columns is 6: # 0 = longitude # 1 = latitude # 2 = seafloor age # 3 = birth latitude snapshot # 4 = point id # 5 for the default gridding columns above, plus additional zvalues added next total_number_of_columns = 5 + len(self.zval_names) gridding_input_data = np.empty( [num_current_points, total_number_of_columns] ) # Lons and lats are first and second columns of the ndarray respectively gridding_input_data[:, 1], gridding_input_data[:, 0] = zip( *curr_lat_lon_points ) # NOTE: We need a single index to access data from curr_points_including_inactive AND allocate # this data to an ndarray with a number of rows equal to num_current_points. This index will # append +1 after each loop through curr_points_including_inactive. i = 0 # Get indices and points of all points at `time`, both active and inactive (which are NoneType points that # have undergone continental collision or subduction at `time`). for point_index, current_point in enumerate( curr_points_including_inactive ): # Look at all active points (these have not collided with a continent or trench) if current_point is not None: # Seafloor age gridding_input_data[i, 2] = ( appearance_time[point_index] - topology_reconstruction.get_current_time() ) # Birth latitude (snapshot) gridding_input_data[i, 3] = birth_lat[point_index] # Point ID (snapshot) gridding_input_data[i, 4] = point_id[ point_index ] # The ID of a corresponding point from the original list of all MOR-resolved points # GENERAL Z-VALUE ALLOCATION # Z values are 1st index onwards; 0th belongs to the point feature ID (thus +1) for j in range(len(self.zval_names)): # Adjusted index - and we have to add j to 5 to account for lat, lon, age, birth lat and point ID, adjusted_index = 5 + j # Spreading rate would be first # Access current zval from the master list of all zvalues for all points that ever existed in time_array gridding_input_data[i, adjusted_index] = zvalues[ point_index, j ] # Go to the next active point i += 1 gridding_input_dictionary = {} for i in list(range(total_number_of_columns)): gridding_input_dictionary[self.total_column_headers[i]] = [ list(j) for j in zip(*gridding_input_data) ][i] data_to_store = [ gridding_input_dictionary[i] for i in gridding_input_dictionary ] # save debug file if get_debug_level() > 100: seafloor_ages = gridding_input_dictionary["SEAFLOOR_AGE"] logger.debug( f"The max and min values of seafloor age are: {np.max(seafloor_ages)} - {np.min(seafloor_ages)} ({topology_reconstruction.get_current_time()}Ma)" ) _save_seed_points_as_multipoint_coverage( gridding_input_dictionary["CURRENT_LONGITUDES"], gridding_input_dictionary["CURRENT_LATITUDES"], gridding_input_dictionary["SEAFLOOR_AGE"], topology_reconstruction.get_current_time(), self.sample_points_dir, ) np.savez_compressed( self.gridding_input_filepath.format( topology_reconstruction.get_current_time() ), *data_to_store, ) if not topology_reconstruction.reconstruct_to_next_time(): break logger.info( f"Reconstruction done for {topology_reconstruction.get_current_time()}!" ) # return reconstruction_data def lat_lon_z_to_netCDF( self, zval_name, time_arr=None, unmasked=False, nprocs=1, ): """Produce a netCDF4 grid of a z-value identified by its `zval_name` for a given time range in `time_arr`. Seafloor age can be gridded by passing `zval_name` as `SEAFLOOR_AGE`, and spreading rate can be gridded with `SPREADING_RATE`. Saves all grids to compressed netCDF format in the attributed directory. Grids can be read into ndarray format using `gplately.grids.read_netcdf_grid()`. Parameters ---------- zval_name : str A string identifiers for a column in the ReconstructByTopologies gridding input files. time_arr : list of float, default None A time range to turn lons, lats and z-values into netCDF4 grids. If not provided, `time_arr` defaults to the full `time_array` provided to `SeafloorGrids`. unmasked : bool, default False Save unmasked grids, in addition to masked versions. nprocs : int, defaullt 1 Number of processes to use for certain operations (requires joblib). Passed to `joblib.Parallel`, so -1 means all available processes. """ parallel = None nprocs = int(nprocs) if nprocs != 1: try: from joblib import Parallel parallel = Parallel(nprocs) except ImportError: warnings.warn( "Could not import joblib; falling back to serial execution" ) # User can put any time array within SeafloorGrid bounds, but if none # is provided, it defaults to the attributed time array if time_arr is None: time_arr = self._times if parallel is None: for time in time_arr: _lat_lon_z_to_netCDF_time( time=time, zval_name=zval_name, file_collection=self.file_collection, save_directory=self.save_directory, total_column_headers=self.total_column_headers, extent=self.extent, resX=self.spacingX, resY=self.spacingY, unmasked=unmasked, continent_mask_filename=self.continent_mask_filepath, gridding_input_filename=self.gridding_input_filepath, ) else: from joblib import delayed parallel( delayed(_lat_lon_z_to_netCDF_time)( time=time, zval_name=zval_name, file_collection=self.file_collection, save_directory=self.save_directory, total_column_headers=self.total_column_headers, extent=self.extent, resX=self.spacingX, resY=self.spacingY, unmasked=unmasked, continent_mask_filename=self.continent_mask_filepath, gridding_input_filename=self.gridding_input_filepath, ) for time in time_arr ) def save_netcdf_files( self, name, times=None, unmasked=False, nprocs=None, ): if times is None: times = self._times if nprocs is None: try: nprocs = multiprocessing.cpu_count() - 1 except NotImplementedError: nprocs = 1 if nprocs > 1: with multiprocessing.Pool(nprocs) as pool: pool.map( partial( _save_netcdf_file, name=name, file_collection=self.file_collection, save_directory=self.save_directory, extent=self.extent, resX=self.spacingX, resY=self.spacingY, unmasked=unmasked, continent_mask_filename=self.continent_mask_filepath, sample_points_file_path=self.sample_points_file_path, ), times, ) else: for time in times: _save_netcdf_file( time, name=name, file_collection=self.file_collection, save_directory=self.save_directory, extent=self.extent, resX=self.spacingX, resY=self.spacingY, unmasked=unmasked, continent_mask_filename=self.continent_mask_filepath, sample_points_file_path=self.sample_points_file_path, )Instance variables
prop PlotTopologiesTime-
Expand source code
@property
def PlotTopologiesTime(self):
    return self._PlotTopologies_object.time
prop max_time-
The reconstruction time.
Expand source code
@property
def max_time(self):
    """The reconstruction time."""
    return self._max_time
Methods
def build_all_MOR_seedpoints(self)-
Resolve mid-ocean ridges for all times between
min_timeandmax_time, divide them into points that make up their shared sub-segments. Rotate these points to the left and right of the ridge using their stage rotation so that they spread from the ridge.Z-value allocation to each point is done here. In future, a function (like the spreading rate function) to calculate general z-data will be an input parameter.
Notes
If MOR seed point building is interrupted, progress is safeguarded as long as
resume_from_checkpointsis set toTrue.This assumes that points spread from ridges symmetrically, with the exception of large ridge jumps at successive timesteps. Therefore, z-values allocated to ridge-emerging points will appear symmetrical until changes in spreading ridge geometries create asymmetries.
In future, this will have a checkpoint save feature so that execution (which occurs during preparation for ReconstructByTopologies and can take several hours) can be safeguarded against run interruptions.
References
get_mid_ocean_ridge_seedpoints() has been adapted from https://github.com/siwill22/agegrid-0.1/blob/master/automatic_age_grid_seeding.py#L117.
def build_all_continental_masks(self)-
Create a continental mask to define the ocean basin for all times between
min_timeandmax_time.Notes
Continental masking progress is safeguarded if ever masking is interrupted, provided that
resume_from_checkpointsis set toTrue.The continental masks will be saved to f"continent_mask_{time}Ma.nc" as compressed netCDF4 files.
def create_initial_ocean_seed_points(self)-
Create the initial ocean basin seed point domain (at
max_timeonly) using Stripy's icosahedral triangulation with the specifiedself.refinement_levels.The ocean mesh starts off as a global-spanning Stripy icosahedral mesh.
create_initial_ocean_seed_pointspasses the automatically-resolved-to-current-time continental polygons from thePlotTopologies_object'scontinentsattribute (which can be from a COB terrane file or a continental polygon file) into Plate Tectonic Tools' point-in-polygon routine. It identifies ocean basin points that lie: * outside the polygons (for the ocean basin point domain) * inside the polygons (for the continental mask)Points from the mesh outside the continental polygons make up the ocean basin seed point mesh. The masked mesh is outputted as a compressed GPML (GPMLZ) file with the filename: "ocean_basin_seed_points_{}Ma.gpmlz" if a
save_directoryis passed. Otherwise, the mesh is returned as a pyGPlates FeatureCollection object.Notes
This point mesh represents ocean basin seafloor that was produced before
SeafloorGrid.max_time, and thus has unknown properties like valid time and spreading rate. As time passes, the plate reconstruction model sees points emerging from MORs. These new points spread to occupy the ocean basins, moving the initial filler points closer to subduction zones and continental polygons with which they can collide. If a collision is detected byPlateReconstructionsReconstructByTopologiesobject, these points are deleted.Ideally, if a reconstruction tree spans a large time range, all initial mesh points would collide with a continent or be subducted, leaving behind a mesh of well-defined MOR-emerged ocean basin points that data can be attributed to. However, some of these initial points situated close to contiental boundaries are retained through time - these form point artefacts with anomalously high ages. Even deep-time plate models (e.g. 1 Ga) will have these artefacts - removing them would require more detail to be added to the reconstruction model.
Returns
ocean_basin_point_mesh:pygplates.FeatureCollection- A feature collection of pygplates.PointOnSphere objects on the ocean basin.
def lat_lon_z_to_netCDF(self, zval_name, time_arr=None, unmasked=False, nprocs=1)-
Produce a netCDF4 grid of a z-value identified by its
zval_namefor a given time range intime_arr.Seafloor age can be gridded by passing
zval_nameasSEAFLOOR_AGE, and spreading rate can be gridded withSPREADING_RATE.Saves all grids to compressed netCDF format in the attributed directory. Grids can be read into ndarray format using
read_netcdf_grid().Parameters
zval_name:str- A string identifiers for a column in the ReconstructByTopologies gridding input files.
time_arr:listoffloat, defaultNone- A time range to turn lons, lats and z-values into netCDF4 grids. If not provided,
time_arrdefaults to the fulltime_arrayprovided toSeafloorGrids. unmasked:bool, defaultFalse- Save unmasked grids, in addition to masked versions.
nprocs:int, defaullt 1- Number of processes to use for certain operations (requires joblib).
Passed to
joblib.Parallel, so -1 means all available processes.
def prepare_for_reconstruction_by_topologies(self)-
Prepare three main auxiliary files for seafloor data gridding: * Initial ocean seed points (at
max_time) * Continental masks (frommax_timetomin_time) * MOR points (frommax_timetomin_time)Returns lists of all attributes for the initial ocean point mesh and all ridge points for all times in the reconstruction time array.
def reconstruct_by_topological_model(self)-
Use pygplates' TopologicalModel class to reconstruct seed points. This method is an alternative to reconstruct_by_topological() which uses Python code to do the reconstruction.
def reconstruct_by_topologies(self)-
Obtain all active ocean seed points at
time- these are points that have not been consumed at subduction zones or have not collided with continental polygons.All active points' latitudes, longitues, seafloor ages, spreading rates and all other general z-values are saved to a gridding input file (.npz).
def save_netcdf_files(self, name, times=None, unmasked=False, nprocs=None)def update_time(self, max_time)